Quantcast
Channel: maps for developers - Medium
Viewing all 2230 articles
Browse latest View live

HD Vector Maps Open Standard

$
0
0
LIDAR data visualized in the browser using Mapbox GL JS to render VT3 tiles

By: Blake Thompson

To keep pace with maps for machines, we are developing a new version of the Vector Tiles Specification, the open standard powering our HD Vector Maps. We’re scoping this specification — known as Vector Tile 3 (VT3) — in the open on Github. Don’t miss my talk at Locate, where I’ll walk through the updated format and how it can radically save bandwidth for streaming data to devices, reducing storage size for larger area coverage offline.

Maps used by machines will play a pivotal role in an entirely new world of robots and automation. So what kind of maps do the robots need? How are maps for robots built? Autonomous vehicles, drones, and AR applications need HD Vector Maps to understand the world around us, and that data needs millimeter accuracy, precision, and the ability to update live as the world changes.

With Vector Tiles, vector data is tiled in small pieces, distributed with low latency around the globe, and it can receive partial updates in real-time as the road network gets smarter. Basically, VT3 brings Snapchat level scale for HD automotive maps, giving your fleet the latest up-to-date maps in the fastest way possible, anywhere in the world.

Improved Metadata for HD Vector Maps

Vector Tiles contain not only the information on where a feature lies, they also contain information that describes what that feature represents. This is commonly known as metadata, and Vector Tiles today can only store it in a simple “key and value” system.

{
"road_name": "Main Street",
"other_name": "Fred Road",
"speed_limit": 50,
"lanes": 3
}

To better organize this data, the VT3 specification introduces new maps and arrays for the metadata.

{
"road_name" : {
"en": ["Main Street", "Fred Road"],
"fr": ["Rue Principale", "Fred Road"]
},
"speed_limit": 50,
"lanes": 3
}

Additionally, we are working to make metadata even more compressed. All together this will result in smaller Vector Tiles and a more developer friendly experience.

3D Data

Maps for machines and AR/VR depend on data that models 3D space. VT3 will support points and lines in full 3D. The amount of 3D data from sensors continues to grow as LIDAR becomes cheaper and more pervasive. LIDAR data is typically very large in size and is rarely displayed in a web client, making it an ideal source as we continue to test VT3 in our products.

Below is a prototype for VT3 using our web mapping library, Mapbox GL JS. It contains LIDAR data collected by the city of Washington D.C that I colorized using our aerial imagery.

Don’t miss my talk at Locate. You can learn more about the VT3 specification and how to contribute in the open repo on Github. Reach out to our team with any questions or ask me on Twitter, @flippmoke.

Blake Thompson


HD Vector Maps Open Standard was originally published in Points of interest on Medium, where people are continuing the conversation by highlighting and responding to this story.


Welcome to Locate

$
0
0

By: Roy Ng

I’m excited to personally welcome you to Locate, where we’re bringing together over 1,400 developers, designers, and the best minds in location tech for two whole days.

No where else will you find autonomous vehicles, augmented reality, billion dollar networks of embedded sensors, and rock ’n roll cartography on the same program. Tickets are completely sold out, and we’ve got a packed schedule in a fantastic space. We’re also racing Donkeycars in the parking lot.

Fantasmo AR point cloud of Pier 27, San Francisco, CA

As I’ve watched our team work tirelessly to make Locate happen, what continues to excite me is that we’re bringing so many different people together — leaders from companies that are changing how we drive, navigate, and interact with our world; product experts pushing maps to the edge of networks; creative designers and engineers building for a post-mobile future — all with different challenges and different visions.

Nick Italiano and Angel Kittiyachavalit built a Locate app with the Maps SDK for React Native. If you’re coming, make sure to download it on iOS or Android.

Use the app to plan your schedule, give feedback on the sessions you attend, and explore a 3D indoor map of Pier 27. We’ve also built in a few surprises, so make sure you’re connected to wifi during the keynote 😉.

See you at Pier 27, registration starts at 7:30AM.

If you can’t make it in person, watch the blog for our latest announcements, and follow the conversation on Twitter with the hashtag #explorelocate.

Roy Ng


Welcome to Locate was originally published in Points of interest on Medium, where people are continuing the conversation by highlighting and responding to this story.

Qt Navigation SDK for automotive and embedded devices

$
0
0

Turn-by-turn directions with real-time traffic and lane level guidance

By: Bruno Abinader

The Mapbox Navigation SDK for Qt is now available with the latest Qt 5.11 release, enabling turn-by-turn navigation with real-time traffic, lane level guidance, and voice instructions. These features add to the beautiful hardware accelerated vector maps and address/point of interest search that we’ve made available since Qt 5.9.

The SDK comes with professionally-designed maps for navigation and user interface templates optimized for driver safety and efficiency — only the most important information is surfaced to drivers at the right time. The maps and UI are also fully customizable.

The Navigation SDK for Qt is a drop-in library that adds turn-by-turn navigation to automotive and embedded applications

We partnered closely with the Qt Company to build the first navigation solution for Qt Location, delivering maps, search, and routing services through Qt Location APIs. This release makes the Navigation SDK available as a new Navigator QML Type allowing for ease of integration via QML.

The Navigation SDK for Qt is now available in alpha release. For more information and to enroll as an alpha tester, head to mapbox.com/qt and sign up.

Bruno Abinader


Qt Navigation SDK for automotive and embedded devices was originally published in Points of interest on Medium, where people are continuing the conversation by highlighting and responding to this story.

Vision SDK

$
0
0

Location with visual context

By: Eric Gundersen

At Locate we’re introducing the Vision SDK — bridging the phone, the camera, and the automobile to give developers total control over the driving experience.

The Vision SDK works in conjunction with our live traffic and navigation, allowing any developer on iOS and Android to build heads-up displays directly into their apps.

Equipped with better navigation, paired with augmented reality, and powered by high-performance computer vision, the SDK turns the mobile camera into a powerful sensor — developers have the key to the car.

Running neural networks directly on the mobile device enables real-time segmentation of the environment. The SDK performs semantic segmentation, discrete feature detection (like spotting speed limit signs and pedestrians), and it supports augmented reality-powered navigation.

As developers use the Vision SDK, they not only get live context directly on the edge but also access to anonymized, real-time data. Hook into events from the Vision SDK, read the data, and control what data to send back.

As part of this launch, we’re also announcing our partnership with Microsoft Azure. Azure’s IoT Edge Runtime is completely open source, allowing developers to process events on the edge and stream incremental data updates to the cloud.

For true live location, we need to reduce latency — the split-second decisions you make when you drive are critical. Optimizing the Vision SDK to the sensors and chips inside devices achieves real-time data processing with extraordinarily low latency. It’s this level of detailed hardware optimization that will give us the performance we need for true live location.

On the hardware side, we’re collaborating with Arm on low power optimization that will bring the Vision SDK to tens of millions of devices and machines. Arm is the company that makes performance computing on the edge possible. Arm powers everything from the microprocessors in your phone to the NVIDIA Drive PX.

Our partnerships with Arm and Microsoft are crucial to making the Vision SDK a reality. If you’re at Locate, you can see this all running in a car on the first floor.

For now, the Vision SDK is only available in private beta for select partners. We will be making it publicly available to everyone in September. Sign up now to be the first to get access.

Eric Gundersen


Vision SDK was originally published in Points of interest on Medium, where people are continuing the conversation by highlighting and responding to this story.

Mobileye RoadBook: High precision HD Maps distributed at scale

$
0
0

HD Vector Tiles power data efficiency and accuracy for autonomous vehicles

By: Eric Gundersen

Mobileye, an Intel Company’s, RoadBook™ provides lane level maps for semi- and fully-autonomous vehicles. RoadBook™ is now available for data-efficient distribution into vehicles through our HD Vector Tiles.

Precision maps provide a critical source of value across the vehicle automation spectrum, enhancing adaptive cruise control and lane-keeping support systems (L2 → L2+) to fully autonomous vehicles (L5).

“Through the cooperation with Mapbox, we enabled a large-scale, low data-rate, cloud-to-car distribution of the RoadBook. This was achieved with the VectorTiles format and by implementing ‘pre fetching’ logic on the agent vehicle” — Erez Dagan, SVP Advanced Development and Strategy at Mobileye

RoadBook™ provides a highly-accurate, rapidly-refreshed representation of the static driving environment. This includes road geometry (lanes, drivable path, paths through complex intersections), static scene semantics (traffic signs, the relevance of traffic lights to particular lanes, on-road markings), and speed information (i.e. how should average vehicle speed adjust for curves, highway ramps, etc).

With this data, an automated vehicle is able to localize itself within the map, have a critical source of redundancy to the physical sensors, and anticipate conditions beyond the range of physical sensors.

“In order for the information contained in the map to be reliable for supporting partial/full autonomy, it must be updated with an ultra-high refresh rate to secure its low Time to Reflect Reality (TTRR) qualities. To address this challenge, Mobileye is harnessing the power of the crowd: exploiting the proliferation of camera-based ADAS systems. These intelligent camera systems are used as harvesting agents to build and maintain in the cloud a near-real-time accurate map of the environment.” — Erez Dagan, SVP Advanced Development and Strategy at Mobileye

RoadBook™ is based on Mobileye’s Road Experience Management (REM), a solution comprised of three layers: harvesting agents (any camera-equipped vehicle), map aggregating server (cloud), and map-consuming agents (semi and autonomous vehicles). The harvesting agents collect and transmit data about the driving path’s geometry and stationary landmarks around it. Mobileye’s real-time geometrical and semantic analysis, implemented in the harvesting agent, allows it to compress the map-relevant information. This facilitates very small communication bandwidth (10KB/km on average).

Mobileye cameras crowdsource live data to the cloud through current wireless communication networks, updating the map in real time. As the data is ingested, it’s fed directly into Mobileye’s private vector maps and then distributed to the vehicles.

This data is tiled in small pieces, distributed with low latency around the globe, and then partially updated in real-time as the road network gets smarter. Basically, this brings Snapchat-level scale for HD automotive maps, giving your fleet the latest up-to-date maps, in the fastest way possible, anywhere on the globe.

Our HD Vector Map format turns real-world coordinates into a local tile grid. A long sequence of coordinates is represented as sequence instructions, radically saving bandwidth

HD Vector Maps support encoding arbitrary metadata from Mobileye, also in a bandwidth efficient, encrypted, high precision format. In the vehicle, embedded Mapbox software decodes the high definition map and dynamically loads map data for 200 meters ahead. This gives the car effectively a look ahead of 200m with the data for localization and redundant perception.

Coordinates traditionally are represented in memory as double triplet (Latitude, Longitude, Altitude). Our HD Vector Map format turns real-world coordinates into a local tile grid. This means a long sequence of coordinates is now represented as sequence instructions. This radically saves bandwidth for streaming data to a car and reduces storage size for larger area coverage.

To take advantage of Roadbook data through Mapbox HD Vector Tiles, get in touch with our team.

Eric Gundersen


Mobileye RoadBook: High precision HD Maps distributed at scale was originally published in Points of interest on Medium, where people are continuing the conversation by highlighting and responding to this story.

Bringing the Vision SDK to the Microsoft Azure IoT Platform

$
0
0

By: Eric Gundersen

Our newly announced Vision SDK integrates with the Microsoft Azure IoT platform. This partnership improves the driving experience inside the vehicle and generates road data on the backend to power analytic solutions for smart cities, insurance companies, and more.

“The intelligent cloud and intelligent edge bring a wide range of possibilities for the future of smart cities, transportation, public safety and more. By integrating Mapbox’s Vision SDK with Azure IoT Hub, developers will have the power of Microsoft’s global-scale cloud platform and advanced AI services to ingest data in real-time.” — Tara Prakriya, Group Program Manager, Microsoft Azure at Microsoft Corp.

The future of location will be building live maps in real time from distributed sensor networks embedded in vehicles and mobile devices at scale. The Vision SDK runs neural networks directly on a user’s mobile device or embedded hardware within a vehicle to segment the environment and detect discrete features like other vehicles, pedestrians, speed limits, construction signs, crosswalks, vegetation, and more.

We’re integrating the open sourced Azure IoT Edge Runtime, which provides custom logic, management, and communications functions for edge devices. Events detected from the Vision SDK integrated with Azure IoT Edge help developers build responsive applications that provide immediate feedback to the driver and stream semantic event data into Azure Cognitive Services for analysis on the back end.

Developers across a range of industries can securely send collision incidents to an insurance platform, for example; or deliver heavy traffic or blocked roadway alerts to a dispatch network. If businesses want to get granular, developers can send regular reports of activity at a crossing intersection to a business intelligence platform to optimize route paths.

For now, the Vision SDK is only available in private beta for select partners. We will be making it publicly available to everyone in September. Sign up now to get access as soon as it’s available .

Eric Gundersen


Bringing the Vision SDK to the Microsoft Azure IoT Platform was originally published in Points of interest on Medium, where people are continuing the conversation by highlighting and responding to this story.

Arm and the Mapbox Vision SDK

$
0
0

Bringing faster machine learning to billions of Arm enabled edge devices

By: Eric Gundersen

To power live location, we’re partnering with Arm and delivering the Vision SDK to Arm’s galaxy of components and hardware — including CPUs, GPUs, Machine Learning, and Object Detection processors.

The Vision SDK puts developers in control of the driving experience. Our partnership with Arm will extend the Vision SDK’s reach to their hundreds of millions of devices. As new data is detected, the SDK classifies road boundaries, lane markings, curbs, crosswalks, traffic signs, and more. This data is then all used to update the map live to ensure the most up-to-date information.

Arm is one of two partners announced today at Locate and is a great complement to the Microsoft Azure IoT Edge and Azure Cognitive Services in the cloud.

“Millions of developers use Mapbox products that will continue to impact many markets. We look forward to working with them to bring the power of machine learning to the edge.” — Jem Davies, Vice President, Fellow and General Manager, Machine Learning, Arm

With the Vision SDK and the Arm-enabled devices already in the hands of billions of people, we’re able to segment and extract features from the environment more than ten times a second. We can now take inputs from sensors that ship on every smart phone and process it all on the device.

Last year, over 20 billion Arm-based silicon chips were shipped, powering everything from sensors and smartwatches, to smartphones and cars. They are the near-ubiquitous processing platform on the edge of the internet and responsible for 100x increase in processing performance in devices over the last 10 years.

Arm offers not only access to billions of chips on the market, but their Machine Learning platform, Project Trillium, enables advanced, ultra-efficient inference at the edge with the highest performance across the widest range of devices today. Specifically designed for ML and neural network capabilities, the architecture is versatile enough to scale to any device, from IoT to connected cars and servers. The recently announced ML processor delivers more than 4.6 trillion operations per second (TOPs) for ML workloads.

Their Object Detection processor can detect objects from a size of 50x60 pixels upwards and process Full HD at 60 frames per second in real time. It can also detect an almost unlimited number of objects per frame, so if you’re processing road data, for example, dealing with the busiest intersection is no problem.

Our Vision SDK is currently available in closed partnerships but will be opened in public beta in September. Visit our page to learn more and sign up for updates.

Eric Gundersen


Arm and the Mapbox Vision SDK was originally published in Points of interest on Medium, where people are continuing the conversation by highlighting and responding to this story.

Mapbox ❤️ Foursquare: Over 100 million places on the map

$
0
0

By: Eric Gundersen

We’re excited to announce we are adding 105 million places to the map this year using the freshest place data from one of our earliest partners: Foursquare. From restaurants and bars to shops, museums, and hotels — the places on our map are about to be updated and made available via search.

13 billion first-party check-ins

Foursquare’s data comes from over 13 billion first-party check-ins, combining machine learning models and first-party data from their consumer apps. The Foursquare database includes over 105 million points of interest and contains valuable venue information, from addresses and opening hours to ratings and need-to-know tips.

What this means for you

Integrating Foursquare as our primary POI data provider — along with our hundreds of other address and place data sources — increases the depth, coverage, quality, and freshness of the data available through our Maps and Search features.

  • Depth: More points of interest for social, travel, and landmarks
  • Coverage: Better regional coverage providing improved coverage globally
  • Quality: Improved data for a richer user experience
  • Freshness: More frequent data updates ensure relevant, accurate results that reflect the world around you

We’ve worked with our friends at Foursquare for years — in fact, Foursquare was the very first user of our global map back in 2012. It is exciting to deepen this relationship and have Foursquare’s data, which we use so often, now as part of our maps.

Eric Gundersen


Mapbox ❤️ Foursquare: Over 100 million places on the map was originally published in Points of interest on Medium, where people are continuing the conversation by highlighting and responding to this story.


Mapbox + kepler.gl

$
0
0

Partnering with Uber to bring advanced data visualization to our developer community

Built with kepler.gl: aircraft travel between FAA traffic control towers over one day across US airspace.

By: Ryan Baumann

Twenty billion connected sensors power our world. From smartphones, to scooters and cars, every sensor is measuring time and location data that can transform business models and products. The problem is, it’s hard to make location data a core part of your product and business decision making process. Understanding this data is more important than ever. If you set the wrong pricing for your mobility business, consumers could choose a competitor’s service. If you don’t respond to slow network speeds for your telecommunications operation, your support engineering team gets slammed and customer satisfaction plummets.

That’s why Uber just released Kepler.gl: a new open-source geospatial analysis toolbox, built on top of our tools, that makes understanding location data simple. Anyone can use kepler.gl to create beautiful, high-performance map visualizations like animated arcs, lines, hexbins, and point clouds. Today, we’re announcing our collaboration with Uber to bring kepler.gl capabilities to our developer community.

“Collaborating on open-source projects can build relationships between companies in the context of pure engineering, where individuals contribute to making software work better, not only benefitting the individual companies involved, but anyone else who might have a use for the tool.”
-Nicolas Garcia Belmonte, Head of Visualization at Uber

The Uber visualization team will add layers like arcs and hexbins from kepler.gl to our new GL Custom Layers API launching this summer. Custom Layers will enable you to go way beyond circles, lines, and heatmaps. You’ll be able to visualize everything from weather simulations, to complete 3D scenes, to huge time series animations — all with the convenience of the GL JS framework and the data scale of our vector tile Maps API. Any visualization you create in kepler.gl can be turned into a Custom Layer you’ll be able to drop into your map. Custom Layers will integrate with your existing map in the same GL context giving you more control over design and boosting your map’s performance.

Custom Layers in Mapbox GL will allow you to more easily create scenes like Concept 3D’s SpaceX launch facility explorer. Instead of synchronizing the map scene with the rocket model scene, Concept 3D can draw directly in the Mapbox GL context, improving performance and making other 3D GL rendering libraries easier to integrate.

Expect to see more 3D model integrations, like Concept 3D’s SpaceX launch facility rendering.

Building with our tools and kepler.gl

Our own Allan Walker gave kepler.gl a spin and visualized all aircraft travel over one day in American airspace using a dataset from ADS-B Exchange. That’s over 250,000 aircrafts updating their positions every 15 minutes. In order to understand how the aircraft positions relate to FAA air sectors, Allan created a custom dark-tinted map style using Studio and combined it with a custom tileset of FAA air sector data. Then he brought his custom map style and the aircraft positions into kepler.gl to create a time-series visualization.

US Aircraft patterns around Chicago O’Hare International airport. You can see the distinct landing, takeoff, and holding patterns in relation to each runway in the animated line layer.

Check out some examples to learn how to build with our tools and kepler.gl, and stay tuned for the launch of the Custom Layers API, which allows you to extend examples like these.

Start building

No matter what you work on, data drives decisions. Now anyone with a big data set can do the same on the web.
-Nicolas Garcia Belmonte, Head of Visualization at Uber

Open-source projects like kepler.gl not only benefit enterprises like Uber who work on them but anyone else looking to solve the same problems with data too. We’re excited to see what developers, analysts, designers, students, and anyone else looking to work with large datasets builds with kepler.gl. This week at Locate we’ll be running a hands-on lab for attendees to get started building with kepler.gl. Can’t make it to Locate? Stay tuned for more resources we’ll release to help you get started, and be on the lookout for meetups in San Francisco to meet others building with kepler.gl, too.

So, what are you going to explore with kepler.gl and custom layers? Tweet us your designs @Mapbox with #keplergl. If you want to use kepler.gl and our tools as part of your product, reach out to our sales team. If you need technical support, email the Kepler.gl team at kepler-gl@uber.com or join the developer discussion on Github.

Ryan Baumann


Mapbox + kepler.gl was originally published in Points of interest on Medium, where people are continuing the conversation by highlighting and responding to this story.

Introducing Native AR

$
0
0

Our new Apple SceneKit SDK + React Native AR SDK

By: Adam Debreczeni

We’re launching two new AR SDKs at Locate, making it easier for everyone to experience location-based AR in their apps.

The new React Native AR SDK enables developers to quickly iterate and build cross-platform. With the new SceneKit SDK, iOS developers can use Apple’s native toolkit to build lightweight and deeply-integrated AR experiences.

React Native AR SDK

The React Native AR SDK is the first of its kind for React Native. Using Javascript and React components, React Native talks to the code at a native level on iOS and Android so you can build for the two platforms at once. The code can co-exist alongside native code, meaning only part of your app has to be React Native.

“Working with Mapbox’s new React Native AR SDK gave us a great toolkit to experiment with showcasing our POIs in a location-based AR experience, and explore the future of what POIs could look like.”
-Peter Krasniqi, VP Global Enterprise & Business Development, Foursquare

With the React Native AR SDK, you can quickly iterate and use React Native’s “hot reloading” feature. If you make a change to an AR experience, just shake the phone to reload the app and see your change immediately — seconds not minutes. We built our app for Locate in React Native, and the new React Native AR SDK powers the AR features inside the app.

SceneKit SDK

The SceneKit SDK brings mapping to SceneKit for the very first time. Using Swift, adding our rich 3D terrain into your iOS app is easy. The SceneKit SDK only adds 500 kilobytes to the binary, which enables you to add AR maps to your application without a size penalty on the App Store.

The SDK also benefits from Apple’s toolchain and tight integration with ARKit. This makes the SDK instantly compatible with any future ARKit features and releases.

The team at Slopes, the iOS app for skiers and snowboarders, used our SceneKit SDK to pull detailed 3D trail guides into their app.

“Using the Mapbox SceneKit SDK enabled me to build a rich 3D location experience in Slopes. The SDK took care of the difficult and time consuming part of rendering and annotating complex terrain data.”
-Curtis Herbert, Founder of Slopes

Maps for Unity

The new native AR SDKs compliment our Maps SDK for Unity, which is our most feature-rich SDK for like location-based games and headsets. Our latest release of the Maps for Unity SDK gives developers tools for easily using our POI data to procedurally place objects around the world with a few clicks or lines of code. Use the POI placement tool to turn Yosemite Valley into a sci-fi landscape by placing a bio-dome at every camp site in the park, or replace every Starbucks in the city with a game character.

Visit mapbox.com/ar to start adding immersive AR experiences to your app or game.

Adam Debreczeni


Introducing Native AR was originally published in Points of interest on Medium, where people are continuing the conversation by highlighting and responding to this story.

Increase operational efficiency with in-app navigation

$
0
0

Own the end-to-end nav experience

By: Bersabel Tadesse

Add navigation directly within your app using the Navigation SDKs for iOS and Android. This provides a single solution for dispatch and navigation in-app, improving end-to-end efficiency and keeping drivers’ hands and eyes free to focus on the road.

When ride share drivers use a third-party app for navigation, they aren’t able to receive dispatching updates in-app, like alerts to pickup another passenger or dynamic routing through areas that contain additional demand. Because the dispatching app and navigation app operate in isolation, the drivers’ only way to receive updates is through push notifications. This obscures the navigation screen and forces drivers to continually switch back-and-forth between apps.

For on-demand companies doing tens of thousands of trips a day, a few wasted seconds per trip switching between apps quickly adds up to tens of hours of lost time each day. Wasted time results in fewer trips and fewer passengers, and at scale, that can add up to millions of dollars of lost revenue a year.

Our Navigation SDKs include professionally-designed maps for navigation and user interface templates optimized for driver safety and efficiency — only the most important information is surfaced to drivers at the right time. We’ve also upgraded our voice guidance in both our iOS and Android Navigation SDKs to Amazon Polly. Prototype a driver app in minutes with beautiful maps, real-time traffic, and turn-by-turn directions.

You can fully customize the map style, UI, and other interactions like voice instructions and language. Incorporate your own data, dashboards, and workflows. Change the map on the fly based on live weather or pass instructions to the driver as they encounter geofenced areas. Everything from the routing profile to each individual map layer can be tailored to your specific use case.

Get started with our Navigation SDKs and add navigation to your app in 10 minutes.

Bersabel Tadesse


Increase operational efficiency with in-app navigation was originally published in Points of interest on Medium, where people are continuing the conversation by highlighting and responding to this story.

Everything that happened at Locate, Day 1

$
0
0

Spoiler alert: it was a lot

By: Rachel Holm

We’ve got a lot to get through in this day one recap, so this update is going to be light on the words, and heavy with the pictures.

1,400 developers, cartographers, data visualizers, technologists, and media navigated their way up the Embarcadero to Pier 27 to explore the edges of location tech with us.

Here’s what went down on day one of Locate.

Every Product Announcement

From top left clockwise: Stephanie Yang (head of data science at Foursquare) announces the integration of 105 million new POIs into our maps; Adam Debreczeni announces our new React Native AR SDK and our SceneKit SDK; Eric takes a ride in a vintage Porsche, outfitted with our Vision SDK, Arm, and Microsoft Azure integration.
  • The Vision SDK: With our vision SDK, we’re bridging the phone, the camera, and the automobile to give developers total control over the driving experience.
  • Our Apple SceneKit SDK + React Native AR SDK: The new React Native AR SDK enables developers to quickly iterate and build cross-platform. With the new SceneKit SDK, iOS developers can use Apple’s native toolkit to build lightweight and deeply-integrated AR experiences.
  • Mapbox + kepler.gl: We’re partnering with Uber to bring advanced data visualization to our developer community. Soon, you’ll be able to add layers like arcs and hexbins from kepler.gl to your maps with our GL Custom Layers API (launching this summer).
  • New Foursquare POIs: We are adding 105 million places to the map this year, using the freshest place data from one of our earliest partners: Foursquare. From restaurants and bars to shops, museums, and hotels — all the places on our map are about to be updated and will be available via search.

Every partnership announcement

  • Mobileye and our HD Vector Maps: Our first HD Vector Maps customer is Mobileye. Together, we are shipping with a major European automaker next year.
  • Microsoft Azure and the Vision SDK: Our newly announced Vision SDK integrates with the Microsoft Azure IoT platform.
  • Arm and the Vision SDK: Bringing faster machine learning to billions of Arm enabled edge devices with the Vision SDK
  • Sumologic integrated Mapbox and Neustar into their core business intelligence tools and dashboards to help customers better measure against KPIs and discover anomalous activity

Best of Twitter

If we missed you on day one, tweet @mapbox with #explorelocate to make it on to tomorrow’s “best of list”.

Rachel Holm


Everything that happened at Locate, Day 1 was originally published in Points of interest on Medium, where people are continuing the conversation by highlighting and responding to this story.

Traveling like a local: How Cool Cousin uses maps to personalize travel

$
0
0

By: Becky Harris

Maps are essential to the Cool Cousin experience. We want travelers to get the most out of a city by visiting the places they like… and that all starts with knowing where you want to go and how to get there.
 — Gil Azrielant, Cofounder and CTO at Cool Cousin

The same recommendation for everyone doesn’t make sense. That’s the thesis of Cool Cousin: the app that offers up customized recommendations to travelers from like-minded locals. When you’re planning an upcoming trip, open up the app to meet a local “cousin”, browse their curated maps, and discover the restaurants and activities that fit your taste. Travelers can browse city guides and direct message “cousins” for specific recommendations and guidance.

I recently traveled to Amsterdam for work and downloaded Cool Cousin to help me plan my trip. Knowing I’d have limited international mobile service, I downloaded a few offline city guides to help me get around. I found a delightful restaurant called Festina Lente in the Jordaan area (recommended by Burney) and grabbed a coffee at a cafe recommended to me by another local, Michal.

After my trip, I connected with Cool Cousin Co-founder and CTO, Gil Azrielant, to chat about the technology powering the app.

Getting There

Our Geocoding API and Matrix API power the app’s “Around Me” feature, which calculates distance and travel times to recommended points of interest in your immediate area

Once you choose your destination, our Directions API gives walking directions to get you where you need to go. You can even fire up turn-by-turn navigation right inside the Cool Cousin app as you walk — no need to close it out and open up a different directions app.

Design

When building out their city guides feature, Cool Cousin was laser-focused on giving users a seamless discovery experience. The team started with Studio and our Maps SDKs for iOS to create a muted basemap showcasing customized points of interest markers. The team was selective about map labeling; as you zoom and pan around, just enough neighborhood and street labels emerge to orient you — not enough to crowd out the “cousin’s” location markers. Runtime styling allows the map labels to change in real-time based on your location and preferred languages.

Toggle points of interest on and off as you explore a local’s personalized city guide.

Our offline maps make Cool Cousin a practical app for on-the-go travelers:

Other providers have well documented APIs, but when it came to design flexibility and support for offline usage, Mapbox had the edge. We don’t want the app to be too heavy on a user’s device — especially because travelers won’t always be in a good service area or near wifi — so we use Mapbox’s offline maps to generate a map preview for each city, and load static images for travelers in spotty service areas.

Up next: living maps

Down the line, the Cool Cousin team wants to include data visualizations to help users know what’s going on around them in real-time.

We want to show users the living pulse of a city. We’re looking into visualizing social check-ins at festivals, parades, and concerts — adding a heatmap layer is a really good way for us to show live anonymized data.

If you’re planning a trip (or even just looking for hidden gems in your own city) download Cool Cousin for iOS and keep an eye out for their upcoming Android release. If you’re looking to build location-based discovery into your app with our APIs and SDKs, drop us a note.

Becky Harris


Traveling like a local: How Cool Cousin uses maps to personalize travel was originally published in Points of interest on Medium, where people are continuing the conversation by highlighting and responding to this story.

Fast maps for Rimac electric hypercars

$
0
0

By: Richard Hurlock

Mapbox is the location partner for the Rimac C_Two autonomous electric hypercar. The navigation experience was built with the Navigation SDK for QT, leveraging HD Vector Maps to stream map data. In addition to the C_Two integration, Rimac will make our maps and navigation available to its OEM infotainment and drivetrain customers.

The Rimac C_Two is an unbelievably fast and beautiful car, and we’re proud to provide equally fast and beautiful maps. The Rimac team styled the maps to match the sleek driver experience of the vehicle. The navigation system itself will support unique features like Rimac’s virtual trainer assist, teaching you how to corner fast on the track.

Rimac Automobili turned heads in 2017 with its launch of the Rimac One, a 1,000 horse power electric hypercar. Rimac is now doubling down with the C_Two, announced at the Geneva Auto show in March, with a breathtaking 1,914 horsepower.

We’re joining leaders in the connected car and autonomous vehicle market at this year’s TU-Automotive Detroit. Stop by booth #B132 to catch a demo of our latest tech. Reach out to schedule a time to meet.

Richard Hurlock


Fast maps for Rimac electric hypercars was originally published in Points of interest on Medium, where people are continuing the conversation by highlighting and responding to this story.

Mapbox + Sumo Logic

$
0
0

Investigate security threats and react quicker with vector maps in Sumo Logic

By: Rachel Holm

Sumo Logic — the machine data analytics platform delivering continuous intelligence — now integrates Mapbox vector maps into their platform. Together, we’re making it easier for companies to understand and act on their own business, security, and operational data. Sumo Logic now uses our vector maps and GL JS to display threat and security geolocation data in real-time. Better yet, DevOps engineers don’t have to export data to other platforms — they can view and analyze spatial trends on maps directly within Sumo Logic.

Sumo Logic uses Neustar to deliver IP geolocaton data to customers, and append log messages with latitude and longitude. With Neustar’s database, Sumo Logic users can take advantage of proactive, real-time alerting. Mapbox GL JS enriches this alerting with more accurate and dynamic maps. rendering in real-time to visualize geolocated events, like performance issues plaguing a particular region or security threats coming from one specific office. Seeing threats and issues appearing in real-time allows DevOps teams to investigate and develop solutions quickly.

Improving the customer experience is at the core of all business and technology decisions today, and has become a major competitive advantage…with the ability to integrate Mapbox technology into the Sumo Logic platform, our users can easily visualize all of their data on interactive maps to identify anomalous behavior, solve problems faster and improve their overall business operations.
— Michael Marfise, Senior Dir. of Product Management, Sumo Logic
Michael Marfise, Senior Director of Product Management at Sumo Logic, was on hand at Locate to help announce the new partnership.

Down the line, Sumo Logic will be able to add new data visualization layers to the map like heatmaps, contextual information displays, and improved log drill-downs.

To integrate our tools into your business intelligence stack, reach out to our sales team.

Rachel Holm


Mapbox + Sumo Logic was originally published in Points of interest on Medium, where people are continuing the conversation by highlighting and responding to this story.


Apple 3D Touch and Taptic Engine Designer, Avi Cieplinski, to Lead Mapbox AR Design

$
0
0

By: Adam Debreczeni

We’re excited to welcome Avi Cieplinski, formerly of Apple and Twitter, as our new Head of Design for AR. Avi comes to us with 14 years at Apple, where he worked on human interaction design, focusing on how we interact with future hardware with a diverse set of inputs like multitouch, trackpads, cameras, keyboards, and other emerging tech.

In his 14 years at Apple, Avi focused on interaction design for experiences never existed before. He worked directly on creating interfaces for the iPhone and iPad. His small team invented and developed Apple’s 3D Touch and the Taptic Engine hardware and interactions. 700 million iPhone users around the world type using these technologies every single day.

More recently, Avi was a senior engineer at Twitter where he worked on UI design and prototyping, feature development, and building a new set of tools to prototype and implement modern, dynamic UIs.

Location-based AR is a unique challenge in which design principles have not yet been cemented. The most basic interactions still have to be explored and prototyped. Avi brings a wealth of knowledge on this front and will lead design on Mapbox’s AR effort to augment the world with location information.

Avi joins us at the perfect time. With the launch of our Reactive Native AR SDK and our Apple SceneKit SDK, we’re opening location-based AR to every developer. Avi’s unique skill set of building for platforms as they emerge will help us continue to provide developers with the best tools and frameworks to explore this new venue.

“Designing for AR is in its infancy, but it’s clear that location is a fundamental aspect of AR. That’s why I’m excited to be joining the Mapbox team. Mapbox is the perfect place for me to combine my passion for exploring new technologies and my love for connecting people with the world around them.” — Avi Cieplinski.

Welcome to the team Avi, we’re excited to see you tackle these challenges!

Adam Debreczeni


Apple 3D Touch and Taptic Engine Designer, Avi Cieplinski, to Lead Mapbox AR Design was originally published in Points of interest on Medium, where people are continuing the conversation by highlighting and responding to this story.

The four things you need to track anything in real time

$
0
0

By: Stephen Lambe

With over 8 billion connected IoT devices and 2 billion GPS-equipped smartphones already online, logistics businesses are tracking assets in real-time at almost every step in the supply chain. The potential impact on operational efficiency, customer service, and on-the-job safety is estimated at 2 trillion dollars in economic value.

For example, Metromile, a usage-based car insurance provider, is using our platform to track where drivers park so they can help prevent parking violations and make it easier for users to find their car. Compology is using image-based sensors to help companies and cities track when dumpsters need to be emptied; they’re using our maps to contextualize all of this live data. Pole Star Global tracks marine vessels as they move through shipping lanes to ensure audit compliance. Pole Star is also using our tools to set up geofenced regions so operators know if they’re entering a potentially dangerous zone.

Pole Star Global tracking vessels along with potential risks like maritime piracy regions and cyclones
Left: Metromile app showing your car location and street sweeping restrictions | Right: Compology dashboard showing dumpster locations

So what do all of these applications have in common? They share the four core components that comprise all asset-tracking solutions: location updates, stream processing, a database, and a map or dashboard. Let’s break these down.

1| Location updates

Location updates (containing an ID, latitude, longitude, and time stamp at a minimum) are what your sensors collect and send, providing a snapshot in time for each asset. A good example is a driver at a ride-sharing company using a driver app equipped with in-app navigation. When using the app, drivers transmit origin/destination information, route paths, or vehicle health data. All of these location updates get posted to an API gateway.

2| Stream Processor

From the API, the stream processor takes over. It receives the location updates and publishes real-time streaming data that you can access with your application stack. Further processing can be done with cloud functions to add special context to the asset updates. For example, you could call our Directions API to include distance from an asset to its destination at a given time. Popular stream processors include Apache Kafka, PubNub, and Amazon Kinesis. We recently held a webinar with PubNub on streaming and mapping data from IoT sensors.

The PubNub webinar covered making heatmaps with millions of real-time data points

3| Database

After being processed, your data heads to a NoSQL database for storage, where it can be quickly accessed using the front-end interface. Any special properties that are added with cloud functions (e.g. distance from destination) can be stored in a single field. The last step before displaying the data is converting the database JSON into a GeoJSON via an API gateway.

4| Map

The fourth and final component is the most visible and important — the tracking dashboard. We built the example below with React and our web mapping library GL JS. The dashboard polls the API gateway and updates 150 assets every second. While it will require some performance adjustments at scale, you can track and visualize thousands of assets in real-time.

The real value of tracking isn’t just knowing live-location, it’s also the insights you collect and analyze over time — the ability to pair historical data with a real-time view of your operations. For a small taste, check out Kepler, the suite of geospatial analysis tools Uber built with our Custom Layers API to analyze billions of live location updates. We’re making the Custom Layers API available to everyone this summer so developers can extend our mapping libraries with sophisticated WebGL visualizations, going beyond circles, lines, and polygons.

Learn more about our Transportation & Logistics industry solutions for asset tracking and other features like distance and ETAs, live traffic, map-matching, and geo-fencing. Reach out to our team with any questions.

Stephen Lambe


The four things you need to track anything in real time was originally published in Points of interest on Medium, where people are continuing the conversation by highlighting and responding to this story.

Reimagine the world with the latest Maps SDK for Unity release

$
0
0
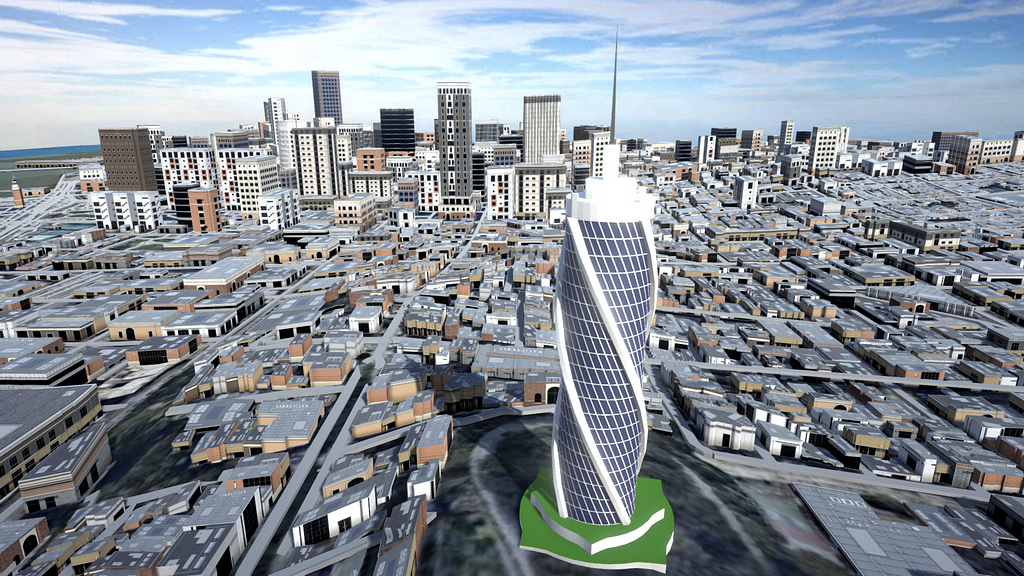
San Francisco’s Coit Tower replaced with a futuristic version using the new ReplaceFeatureModifier

By: Miroslav Lysyuk

The Maps SDK for Unity 1.4.3 release streamlines your ability to customize our global building data with new easy-to-use building replacement and styling features. Developers working in everything from gaming to architectural design will find these updates a welcome addition to their workflows, making it easier to combine custom designs with real world data.

Replace any building in any city

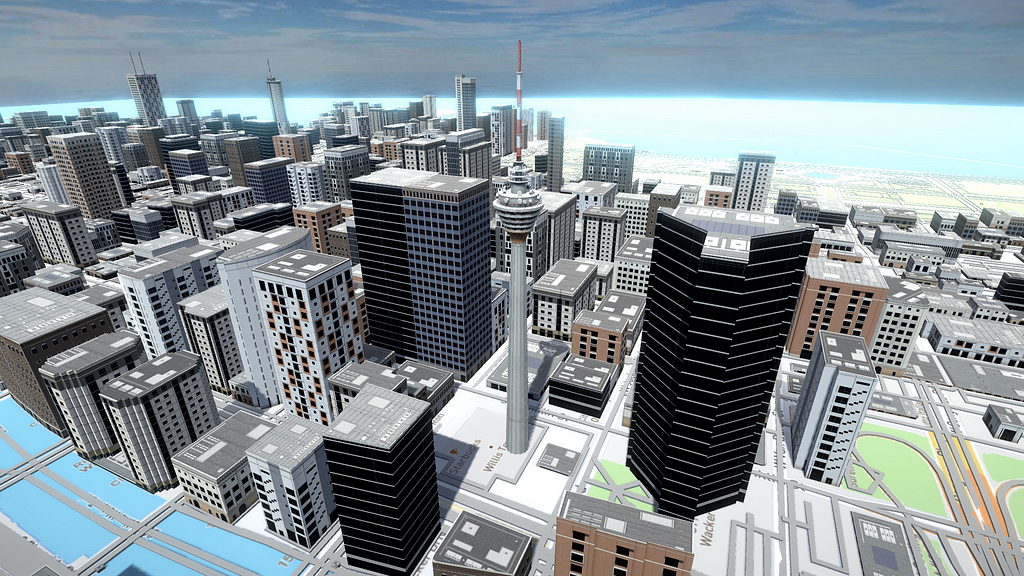
With the new ReplaceFeatureModifier you can select any 3D model and assign it to replace buildings at any latitude and longitude coordinates you specify. Visualize custom architectural models in the context of a city or turn any city into a futuristic landscape for a game using the real-world model as a starting point.

The Willis Tower in Chicago replaced by a Kuala Lumpur Tower model

Prepackaged styles from realistic to fantasy

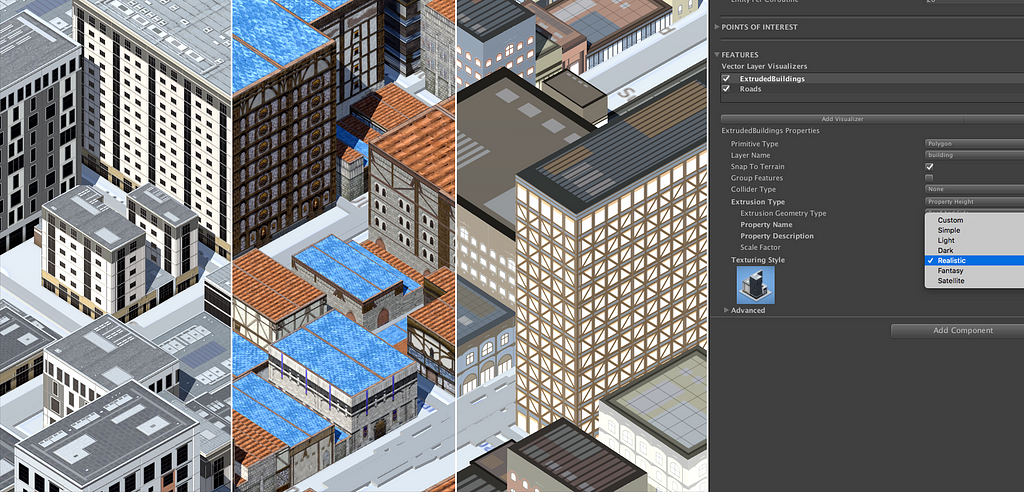
You can now select from several default building styles included with the SDK or customize your own. Our hyper-realistic, fantasy, or simple light & dark styles give you versatile launching points for your projects. With the Custom styling option, you’re able to define texturing with our Atlas guides, making it easier to generate and style your worlds based on the real one.

The same section of a city with some of our newly included default styles.

Check out the full list of updates in the changelog and update to SDK 1.4.3 to start modifying the real world.

Miroslav Lysyuk


Reimagine the world with the latest Maps SDK for Unity release was originally published in Points of interest on Medium, where people are continuing the conversation by highlighting and responding to this story.

Exploring the edges of consumer-facing apps

$
0
0

By: Becky Harris

Over two days at Locate, consumer apps and brands showcased how they’re using location tech to better engage and retain users. Pinning user data to a map gives users a nontraditional way to browse and discover content — just take a look at Snap Map. Some apps have taken it further, using a customized map as their primary product interface.

With over fifty panels, and 100+ speakers, three larger themes seemed to dominate B2C-focused conversation.

1) Brands are breaking user expectations by customizing maps

We all know what to expect when we look at a map — blue represents water, parks are green, and red pins show you where you need to go. However, developers are finding success when they break these consumer expectations and play with customization and design to differentiate their apps from the competition.

Lonely Planet, a company with a 40-year history, translated their colorful brand identity and iconography from printed travel guides into digital maps, ensuring consistency across their product portfolio. Aaron London, Head of iOS Development, explained that this consistency provides a seamless user experience as people switch between Lonely Planet’s print guides, websites, and mobile apps while traveling.

Lonely Planet customizes the maps in their apps to reflect the brand’s long-standing identity and iconography

The festival and events app, Woov, takes map customization to a whole new level. Woov builds one-of-a-kind festival maps to engage festival-goers, helping them navigate a festival’s key stages and keep track of their friends.

The experience we build in maps has to match the experience music festivals build for their attendees. That’s why we invest so heavily in map customization — Sebastian Westerduin, Founder of Woov

You can see that customization at work in the creative icons and fun animations in Woov’s bespoke maps.

2) Data visualization layers show users how they fit into the larger community

Brands and apps are leveraging data visualization to help users understand how they relate to a larger user network.

The fitness app, Strava, layered their global data set of anonymized biking, swimming, and running route data right onto map tiles. With this global telemetry heatmap, users can zoom and pan around the expansive map to discover routes in their immediate area and across the globe.

While Strava’s heat map lets users explore data across a global user-base, Ancestry DNA uses visualization layers to provide a personalized experience for each customer. The team at Ancestry layered customized polygons and flow lines onto their maps to demonstrate the gene migration patterns for a given user’s DNA.

3) Maps and AR are driving action in the real world

Brands are building challenges into their apps that get users to explore their physical surroundings.

For example, during the lead-up to Easter 2018, Snap integrated a geocaching game into Snap Map to get users to interact with the world around them. To play, users looked to the map to guide them to “easter eggs” that were hidden at various stores and landmarks. As players neared their desired location, a simple AR mask revealed a hidden egg to collect.

Rever — the app that lets the motorcycling community record and navigate planned rides — creates challenges in their app to incentivize riders to get outside. For the Honda Pass Bagger Challenge, Rever challenged riders to visit as many of America’s mountain passes as they could. Over the course of the challenge, 2,400 riders completed 32,500 rides, hitting 2,600 locations.

The challenge winner visited eighty one locations.

Custom maps, data visualization layers, and app-enabled experiences like these help companies drive repeat engagement and build brand loyalty.

To make your app stand out and engage users, drop us a line, or check out our mapping and location data tools for B2C apps and brands.

Becky Harris


Exploring the edges of consumer-facing apps was originally published in Points of interest on Medium, where people are continuing the conversation by highlighting and responding to this story.

Venmo Tech Lead, Amy Jin, joins Mapbox to lead Accounts Engineering team

$
0
0

By: Young Hahn

I’m thrilled to welcome Amy Jin to the Mapbox team!

Amy joins Mapbox as Accounts Engineering Manager in the Platform Division where she’ll lead our team and tech around authorization, accounts, billing, and payment systems. These foundational services help power our APIs and drive our developer adoption and growth.

Amy comes from Venmo where she served as the tech lead for multiple engineering teams around peer-to-peer payments and Venmo’s transaction validation systems. Amy was a key part of the early team at Venmo where she helped build the product, define key engineering practices, and lead the team through numerous phases of growth.

I’m excited to see Amy’s technical leadership at Mapbox. Her work at Venmo had a broad footprint — from defining team on-call systems to scaling infrastructure. From our conversations, it’s clear Amy has an intentional, disciplined approach to mentoring engineers and helping them improve their craft.

Welcome, Amy!

Young Hahn


Venmo Tech Lead, Amy Jin, joins Mapbox to lead Accounts Engineering team was originally published in Points of interest on Medium, where people are continuing the conversation by highlighting and responding to this story.

Viewing all 2230 articles
Browse latest View live