VICE News Tonight publishes original reporting with an on-the-ground perspective of breaking news, from the riots in Charlottesville, Virginia this past August to more recent events like post-hurricane Puerto Rico and the Catalan vote for independence. The show features several stories per episode with a fast-moving narrative. VICE uses our tools to quickly create custom maps as the news breaks, providing viewers with more context on what’s happening and where. We grabbed a couple recent examples to show how maps are supporting their broadcast programming.
In The People Who Rule the Word’s Smallest Countries episode, VICE covers the leaders of “micronations” as they organize for a summit in Dunwoody, Georgia. Micronations are self-declared, sovereign states not formally recognized by any official authority, which is why you may not recognize all of the flags on the map below. If you do, then props.
VICE is using a custom map style with clear borders and icons to highlight these obscure “nations” like Molossia, Slobovia, The Aerican Empire, and of course, Queen Anastasia von Elphberg’s Ruritania. The map is customized to VICE’s signature white-on-black aesthetic, subtly blending the brand into the story. In just a few frames, viewers can see that micronations are a global trend with a surprisingly high concentration in Europe; they may also notice that some of these fringe movements are closer to home than expected.
This custom map style makes a second appearance in Puerto Rico Night Watch & Catalan Votes during a segment covering the vote for Catalonian independence. The stark borders and highlighted polygon in the map below quickly provide a sense of location and scale — Catalonia, for example, is roughly the size of several Eastern European countries, so you immediately see that the independence movement impacts a significant territory of Spain.
With a plan tailored to their needs, VICE has the resources to keep pace with the news cycle and develop custom maps for broadcast. Want to tell stories with maps? Contact our sales team to learn about Enterprise licensing for film and television projects.
Maps on VICE News Tonight was originally published in Points of interest on Medium, where people are continuing the conversation by highlighting and responding to this story.
Lauri Rustanius is a professional skater turned AR game designer out of Helsinki, Finland. He continues to push the boundaries of AR gameplay and mixed reality environments using our tools, and he’s the newest member of our Unity team.
Recently, I was invited to San Francisco to visit the Mapbox office. I worked with the team to build a demo showing what’s possible with the Maps SDK for Unity.
Naturally, we imagined a spaceship flying over San Francisco — but how would the city defend itself? Using Mapbox building data that’s accessible in the Maps SDK for Unity, we mapped turrets to real-life buildings right in front of Mapbox’s SF office. This caused the aliens to retreat, ensuring the safety of San Francisco and the entire human race — it was a productive visit.
Created an intergalactic moment outside the @Mapbox office in San Francisco, using #arkit #unity3d #mapbox https://t.co/KU77ibKkFL
Making this demo is actually relatively easy with the current setup. Using the experimental build that Mapbox provides we can “anchor” augmented reality experiences to real-world coordinates. I used the Manual Synchronization scene in the build to align the buildings correctly for occlusion.
For debugging, I added transparent shaders (Unity provides these off-the-shelf) to the building meshes. Also, there are rocking occluding shaders to make it seem like the spaceship is actually above the building.
After getting the initial position, we moved the buildings manually to match the real world position. For now, we don’t rely on automatic tracking due to device accuracy limitations. Once we were happy with the alignment, we placed turrets along the building surface. The turrets are on patrol mode; as soon as they see the spaceship, they open fire.
Overall, we are just scratching the surface of what can be done with location data when combining the power of Unity and ARKit. It really is amazing. I highly recommend to at least play around with the Maps SDK for Unity and the Mapbox Unity + ARKit library. The latest version supports a node editor and comes with a lot of example scenes to help you get started.
Alita Macias just joined the Mapbox Recruiting team after an 8 year run with a leading retained search firm, Daversa Partners, that tech investors, founders and CEOs lean on to recruit top executives. Before becoming a recruiter, she specialized in client management and sales for digital media startups.
Alita’s expertise helping tech companies grow their leadership teams will be incredibly valuable as we build out our business and go-to-market infrastructure at Mapbox. We’ve architected the foundational parts of the mapping stack and are now poised for radical growth. We’re looking for diverse team members to build the next layer together. Build with us, grow with us!
Good morning Minsk! Today Mapbox is bringing on the deep learning team at MapData, a neural network-based map SDK team in Minsk, and we plan to open a new office in the High Tech Park in the city. The team in Minsk will be dedicated to supporting deep learning, computer vision, and self-driving vehicles to complement our larger investments in autonomous driving and growing presence within the automotive sector.
Navigation apps have not innovated in years. Drivers are looking at 2D maps on their phones like the old school atlas our parents had — we can do so much better. As the device bezels fade away, front-facing cameras and navigation displays need to merge. Drivers should see an augmented reality, with directions showing up in front of where they need to turn. Phones will be the heads-up displays of the future without the need for expensive hardware.
“It’s great to see how fruitful cooperation during the last one and a half years has grown into a new breathtaking project. My big dream was always to have and ride in a self-driving car. It’s incredible that I get to be part of it and work on creating it,” said Alexander Matveenko, General Manager for Mapbox in Minsk.
During the past few years, Minsk has been rapidly growing as an innovation hub. Mapbox has been successfully working with developers in the city for the past 18 months, and we felt the timing was right to expand our investment there.
“The President of Belarus is expanding benefits for the members of High Tech Park area in Minsk and making it easier for companies to set up shop,” said Denis Alienkov, Alienkov & Partners, who has been supporting our work in Minsk.
Mapbox was initially introduced to Minsk by Yury Melnichek, the founder of Maps.me and lead investor AIMatters. Yuri is an advisor to me and our team.
“The combination of technical talent and a really dedicated work ethic is going to drive a lot of startups here. I believe this is an ecosystem that is important for Mapbox to be a part of,” said Melnichek.
Mapbox in Minsk was originally published in Points of interest on Medium, where people are continuing the conversation by highlighting and responding to this story.
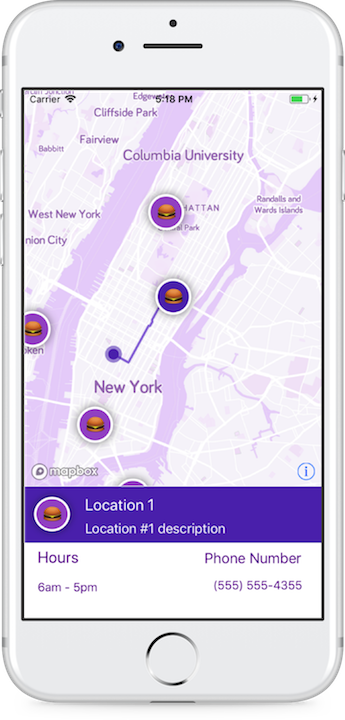
Today, we’re releasing our iOS Store Locator Kit, a plug-and-play solution that reduces the time it takes to set up and develop a beautiful store locator in your app. Download the kit, and you’re able to integrate a locator into any iOS application in just a few hours. Your users can then view several locations, browse additional information, and preview the distance and route to each. Use this Kit to visualize the location of anything, from bike share hubs to bus stops to ATMs to parks.
This Kit comes with all the necessary tools for a live iOS app. It is a “pre-styled app” that you can add light or heavy customization to based on your needs or your brand’s UI. You can even use the Kit to update an existing store locator app. To get started quickly, take a look at our new tutorial.
We’re now launching this iOS Store Locator Kit as a companion to the Android Store Locator Kit released a couple months ago. Since then we’ve already seen some great examples of our community building with the Kit, from locating classrooms to locating a nearby bike-share hub.
Turn your @UW schedule into a @mapbox powered android map! Modified https://t.co/1YVra7O4kl to tell me where class is. #weekendmaphack
Store Locator Kit for iOS was originally published in Points of interest on Medium, where people are continuing the conversation by highlighting and responding to this story.
Recalling city destruction arcade games from my childhood, I wanted to see how quickly I could build a destructible game environment using real-world city data in Unity.
Creating individual GameObjects and mesh colliders for each building is simple — check out this tutorial. We can also apply random materials to each building for texture variation. All of these assignments are done using the Map Factory Framework, which you can visualize in the new Map Editor.
For building destruction, I remembered a fantastic presentation by Richard Fine. In this presentation, Richard used scriptable objects to create intricate destruction sequences, complete with animation, camera shake, sound effects, and particle systems. I pulled his example repository assets into my project and assigned a Destructible component to each building, also done through the Map Factory Framework.
Added a RigidBody component to the Kaiju to detect collisions with building colliders
Implemented a tap-to-move system using Unity’s built-in navigation components
Given the ease of ARKit integration in Unity, I thought it would be fun to turn the player into Kaiju. To do so, I simply imported Unity’s ARKit plugin and constrained the Kaiju to the AR-enabled camera. Now, you can destroy buildings just by walking!
Thanks to the modularity of our Maps SDK for Unity and the ease of prototyping in Unity, I built a proof of concept for my new game in just four hours! What will you build?
As a member of the support team at Mapbox, I help users build out their ideas and troubleshoot problems. Recently, I faced a challenge involving events in Mapbox GL JS that was not only an interesting problem to tackle but also sheds light on how to work with the MapDataEvent when a tile belonging to a source changes in some way.
A user contacted us about filtering points for a specific feature and then displaying the name associated with that feature on the map. The problem was that after the points on the map were visually filtered, the name property of every point was still being displayed. Why wasn’t it showing the data for just the single filtered feature? Take a look at the problem below:
When I initially examined the code, nothing seemed out of place. To troubleshoot, I printed the layer’s features in the console and confirmed the issue. Although the points on the map were visually filtering, the data didn’t appear to be changing. It seemed that setFilter() might be working asynchronously and not completing the process of filtering until after the data was printed. I decided to use setTimeout() to test this theory by delaying the printing of the features for a few seconds, and it worked! This proved that the data needed more time to filter before proceeding with the rest of the code. My next step was to dig into Mapbox GL JS documentation and find a solution for the user.
I learned from the docs that any time an event is fired changing the map’s data in some way, an object is emitted that contains the boolean isSourceLoaded. If isSourceLoaded is false, this means there is still work being done to load or update the source data. This was exactly the information I needed. I tried printing the value of isSourceLoaded in the console for every sourcedata event that fired and saw that the features were printed before true was finally returned. To correct this, I attached an event listener to sourcedata, ensuring the source loaded completely before allowing the rest of the code to execute. See it in action below:
This approach is especially useful when you need to use Mapbox GL JS functions that change the source in some way — like setFilter() and setData(). For more information on Mapbox GL JS events, check out the Mapbox GL JS documentation and examples.
Whether you’re just starting out with Mapbox, or are a seasoned user our team is here to help. Start by trying some of our tutorials or visit the Help Page to get in touch.
Building Canada 2020 is a community-led initiative driven by a simple and clear vision: map all buildings in Canada on OpenStreetMap by the year 2020. During OSMGeoWeek (November 12–18), we’re supporting a series of mapathons at Canadian universities and colleges to reach this goal.
An almost complete dataset of all buildings in Ottawa now exists after Statistics Canada collaborated with Canadian citizens.
An open-source dataset of buildings is an important asset for Canada because it gives anyone the ability to conduct analyses and build tools with that data. For example, building footprints and wheelchair attribute data are used to assess the city’s accessibility. Building data can be merged with property assessment data to visualize property assessment values, or it can be merged with zoning data to visualize allowed versus actual buildings heights.
Visualizing property assessment data in Vancouver. Credit: Eugene Chen, Darkhorse Analytics
Apart from urban analyses, the building data is also used for disaster response. During spring 2017 when Ottawa and Gatineau experienced severe flooding, the Canadian Red Cross used building information within OpenStreetMap to validate the number of homes impacted by the high-water levels. They also used this data to produce base maps of the affected area for planning and delivering assistance. Similarly, this past summer, British Columbia, Canada, was in a state of emergency as several forest fires devastated homes across the province. Building footprints were used to conduct impact assessments, so agencies had a more accurate picture of the damage.
#BC2020 Mapathons
We’ve been working closely with Canadian colleges and universities, to help them host mapathons, which bring people together to map the world in OpenStreetMap. Mapathons are a great way to educate students on the open-source GIS tools that are increasingly used for geospatial analysis. It’s also an opportunity for students to learn within a real-world context and contribute meaningful work. I made a wiki for the Building Canada 2020 mapathons during OSMGeoWeek2017; it includes recommendations and resources for hosting your own.
We are creating projects for the Canada OSM Tasking Manager, which will provide all of the background on how to map buildings and also specify which Canadian regions to map. During OSMGeoWeek, we are focusing on mapping rural regions, where building footprints can’t be imported and where there is little-to-no map coverage on OpenStreetMap.
Williams Lake, British Columbia, Canada, has no open dataset of buildings and is hardly mapped on OpenStreetMap, yet it has been affected by forest fires. McGill University will be mapping this region for their mapathon
Join the Initiative
It isn’t too late to organize a Building Canada 2020 mapathon. If you are interested, contact me, and if you want to contribute to the Building Canada 2020 initiative, check out the project’s wiki page. Already organizing a mapathon for OSMGeoWeek? Don’t forget to register!
Today, Virginia’s 5,489,530 registered voters head to 2,476 polling stations across the state to elect their next governor. This gubernatorial race is a closely contested bellwether in a key swing state.
The New York Times’ graphics team built an election map that is interactive, fast, and visually compelling. The map takes a different view of the votes — examining results by precinct, estimated votes remaining, lead margin, and electoral shift — and provides a real-time view as counts are reported.
Note: Not an indication of final results, from original mockup of the map.
Behind the design
To build a basemap that provides context without competing with their data, the graphics team used Studio to simplify the map’s color palette and remove all but the key geographic references, like city labels, highways, and waterways.
Results as of 8:15 pm ET.
As votes come in, the map uses data-driven styling to fill the color of each precinct based on multiple properties, including percentage of votes counted, winning party, and margin of victory.
Expressions for responsive maps
To understand whether and how voter sentiments have shifted since the 2016 presidential election, the graphics team used GL JS expressions to create an electoral “wind map.”
Note: Not final results, from mockup.
The color, direction, and length of the arrows show the winning party in this election and the magnitude of the electoral shift since the 2016 presidential election.
Results as of 8:15 pm ET
Similarly, the graphics team used expressions to style circles that show the margin of the leading candidate’s lead in each precinct.
Note: Not an indicator of final results, from mockup.
In both cases, GL JS adjusts the arrow and circle sizes based on map parameters like viewport and zoom to ensures readers have a balanced view of the data no matter their device or view.
In anticipation of GIS Day, Indiana University is celebrating the exciting work the community is doing with Geographic Information Systems (GIS). Together with our partner, The City of Bloomington, we’re launching the Open Data Challenge, leveraging the wealth of data made available on Bloomington’s open data portal.
In this contest, students hone GIS skills and use data to solve real needs for the city. Registered students of Indiana University or any other university are eligible to submit maps, tools, and solutions for two challenges the City of Bloomington has identified:
Using open data, visualize crash locations in Bloomington showing additional details such as type of road user, cause, and traffic volume at that location.
Help City of Bloomington Volunteer Network connect people to volunteer opportunities by creating a web map showing the locations of service organizations in the community.
Excited to test your skills?
If you’re a registered student, sign up and get started. The submission period for the contest is 11/8–12/13.
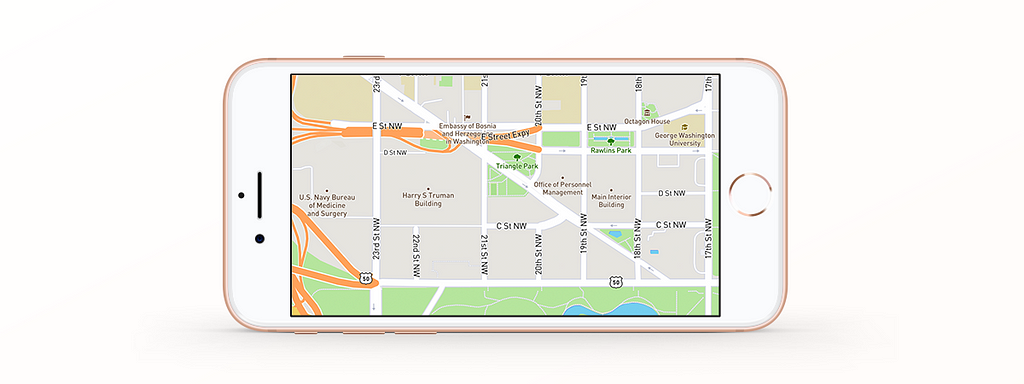
Taking your product cross-platform? Working on a few UI tweaks of your app? Here are a few tips to keep in mind to optimize your map for mobile:
Lessen information density. Maps for mobile are basically crops of maps for web. We are dealing with the same map in a smaller viewport, aka smaller screen sizes. Make sure to check the density of data on your map style. At times, you may want to lower the density to show less information due to the smaller viewport.
Check font sizes and weights. Based on the resolution of the mobile device, the fonts on your map style may appear much smaller and bolder on mobile devices than on the web. For example, the iOS environment favors thin fonts to a fault; even a font that would be considered neutral weight on the web appears as bold on iOS. Standard fonts and sizes are different on Android than they are on iOS. You may also need to alter halo sizes a bit to help with legibility.
Location, location, location. Mobile devices are used by people sitting on the couch at home, walking around, inside or outside, waiting for a bus, train, or plane, or traveling in a variety of situations. We make styles for day and night for these reasons, particularly with maps for navigation.
Contrast and importance. Low-contrast text is difficult or impossible for many users to read, especially on mobile devices. Background and foreground colors should have a sufficient enough contrast ratio to guarantee readability. You also want to design in a hierarchy for iconography as well as text. For example, you may want to style highway shields and transit icons to be unobtrusive but visible while designing the lesser important points of interest, like dog parks, with less visibility.
Testing. You always want to view and interact with map styles you make on their final device. You can quickly test mobile styles on Studio Preview for iOS and Android.
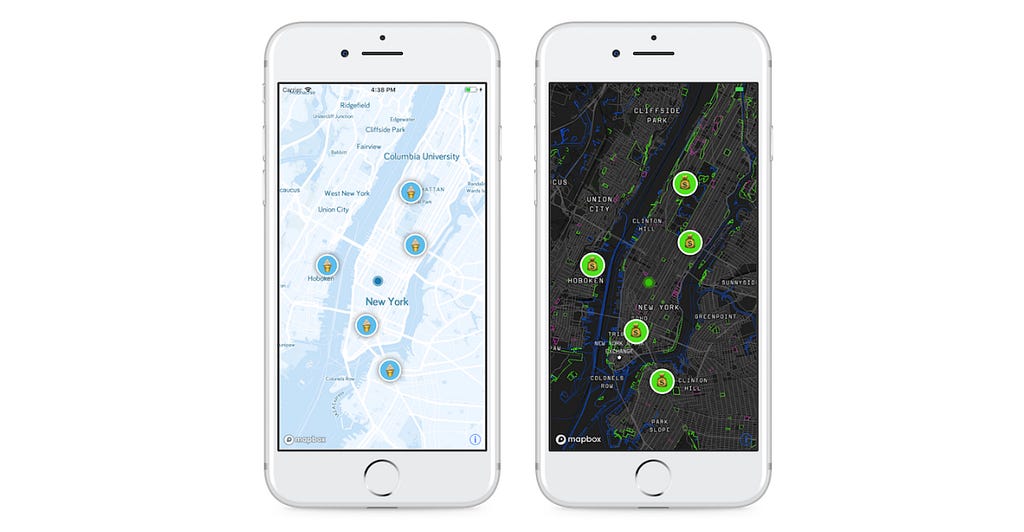
We just released our Maps SDK for React Native, a cross-platform solution of reusable JavaScript components for building mapping & location into your Android and iOS apps.
With React Native, you can write your app once and reduce the cycle time it takes to develop high-quality mobile applications. It eliminates the need to recompile your code and lets you take advantage of the rich JavaScript components within the React Native framework.
React Native app example of an ice cream store finder on Android (left) and iPhone (right)
Take a look at how we used React Native to build the store locators above for both iOS and Android:
Our Maps SDK for React Native brings all the functionality of our Maps SDKs for Android and iOS to React Native and builds upon the alpha we released a few weeks ago. This new SDK version also supports runtime styling and data-driven styling, allowing you to dynamically change the map style and data displayed on your map in real time within your hybrid app. The SDK includes abstractions like our stylesheet component to quickly style your map layers similar to CSS, as well as full compatibility with React Native’s Animated API.
With the combination of runtime styling and data-driven styling, as well as our stylesheet component, you can customize every single aspect of your map. Here we’ve clustered together thousands of earthquakes as points on a map and visualized how many earthquakes are within a given radius. The ShapeSource in the SDK includes a clusterRadius option allowing you to pass in a data source with a collection of points. With data-driven styling, you can then filter and style the data source based on the radius.
Clustering earthquakes using the Maps SDK for React Native
Explore our Maps SDK for React Native and get started with our First Steps tutorial. Ping me @nitaliano in our GitHub repo with questions, features requests, or if you would like to contribute to the SDK. Stay tuned for more updates as we continue supporting React Native developers building with our tools.
Maps SDK for React Native was originally published in Points of interest on Medium, where people are continuing the conversation by highlighting and responding to this story.
October is Security Awareness Month in the United States. To raise awareness about security threats, we celebrated with a series of hacks against everyone in the company. This was a fun competition to see who could identify the most hacks before the security team “captured” them.
Scaling security is hard. As a security team, we can’t have eyes and full automation everywhere. Certain threats require team members across the entire company to make good security decisions where they should be the first line of defense. Good training is time-consuming; people may not always listen to presentations or read through guides and checklists. Even with the right training, if your environment is stifling or punishing, people won’t feel comfortable reporting a real security issue. We needed a creative way to show our team both the necessities of being secure and that it’s safe to report issues. To accomplish this, we enveloped our Hacktober event with empathy and a code of ethics.
Hacktober, our month-long company-wide red teaming event, was our way to provide fun and practical training on basic security principles, show ways for staff to secure themselves, as well as to compete with the rest of Mapbox to see who could identify the most hacks. It was also our way to internally test how our security operations team receives, triages, and resolves security reports. Our main motivation was to make this security training memorable and enjoyable — and not a death by PowerPoint experience.
For example, we teach that wandering, unknown USB sticks are bad to stick in your computer. But for many, experiencing is believing. While a malicious USB stick may not be the most common threat in corporate America, this exercise of being hacked re-enforces the larger issue of trusting unknown files, whether on a USB drive, in an attachment within your customer support software, or an attachment in an email that appears to be from someone you work with.
Empathy & Blamelessness
To kick off Hacktober the security team posted an internal blog post with all of the logistics and competition information. Even more importantly, we re-iterated Mapbox’s core value of empathy and how it relates to reporting security issues. Bad news does not get better with time. As a security team, we strive to create a safe environment that allows people to report issues without feeling they will be blamed or victimized.
To foster this environment, we practice blameless post-mortems. If a team member falls victim to an attack, we look at ourselves first. Do we have documentation that teaches that particular security concept? Is that documentation easily accessible? Are people aware this documentation exists? These questions better position our team to teach people how to thwart future attacks.
When you are hacking the entire company, it’s important to have ground rules. People’s time and data are precious. We didn’t want to perform a hack that would cost someone’s entire day nor would we want to reveal private information. We didn’t delete or ransom any data or disrupt production. By knowing our valuable assets and threat model, we designed this red team exercise to teach people basic security concepts without sacrificing time, money, and mental health. This helped us teach valuable awareness and build trust with our team.
Hack. Learn. Repeat.
When we saw multiple people falling for the same hack, we would write up internal posts educating everyone about the warning signs and consequences of falling for the hack. We repeated the hacks in slightly different formats in order to measure peoples’ ability to identify and report attacks after these education efforts.
Our red team commanders orchestrated the attacks each week. As a team, we aimed to launch 3–5 attacks per week across all our offices spanning from DC to Bangalore, India, even including our remote employees. We also had our red team commanders switch out weekly, which gave each new hack a fresh perspective. Since the red team commander had the most eyes on the ground, they were in the best position to evaluate how well the attack went and what our strength and weaknesses were as a company. To make an effective switch, we held a weekly retrospection meeting that captured what happened that week, what would happen the next week, and what was and was not working.
If somebody fell victim to a Hacktober hack, we kept this information private and within the security team, just like we’d do in a real scenario. Mistakes turned into teaching moments that framed our posts. We told the story of the hack, how to identify it, and explained the trust the attacker was trying to exploit so that people would understand the mindset and strategy behind threats. Some of the most powerful moments of the event were when an individual fell victim to an attack and then immediately shared with neighbors what happened and how they were tricked. This spread the word about security and risk to people not even directly affected by an issue. In fact, the word Hacktober eventually became a verb — “I was Hacktobered!”
Points & Competition
Friendly competition keeps things fun, so we rewarded points for those who reported a security event. We didn’t announce any of the Hacktober hacks; anything that seemed odd and suspicious was up for grabs! It was then up to our security operations engineer who was triaging security reports that week to determine if the report was valid. If it was valid, both the threat reporter and Team Mapbox would be awarded a point. For any hacks that went unnoticed or if people fell victim to them, the red team would get a point. By having an individual and company-wide point system, we could track who found the most hacks and how many reports in total were received.
The prize for reports? Anyone’s first report would earn them a Hacktober sticker. The top 25 people would receive a special branded Mapbox Hacktober shirt.
This points system actually led to people reporting issues that wouldn’t have normally been reported but were security issues we needed to address, for example leaving a WiFi password up on a whiteboard in a meeting room. Because no one knew what was a hack and what wasn’t, it raised situational awareness for everyone. Does that mysterious suitcase belong to someone or are you being Hacktobered?
Nothing is safe during #hacktober w/ @hmjudge #lifeatMapbox
We integrated Hacktober hacks as part of our existing on-call process, so we could test our own Incident Response Framework. The security operations team at Mapbox maintains a 24/7/365 on-call, multi-tiered schedule. The person currently on-call would be the “blue team commander” for the week and would triage reports as they come in. Keeping the blue team out of the loop as much as possible allowed us to see where we needed improvements. For instance, we realized the way we handled phishing attacks was too time intensive and noisy. We have since streamlined our process, reducing back-and-forth followup.
Before kicking off the event, we ensured our internal documentation was up to date. We have a help file that explains how to report a security issue, how to escalate a security issue, and an FAQ. Reinforcing the correct way to report a security issue minimizes the likelihood an issue will be reported out-of-band, such as through a direct message in Slack or a random mention in a channel that could go unnoticed. We put a lot of effort into training our team how to communicate with us, so that they would know exactly where to find help or report issues after Hacktober.
Keeping up the momentum
A month is a long time to run a security event; we had to be creative to maintain enthusiasm and interest.
Our awesome spaces team created wonderfully designed security-themed “Fun Fact” posters every Friday. These posters included a recap of Hacktober and who was in the lead, fueling the competition.
After each week, we would also recap the hacks in an internal post. Because people saw that our red team was successful in hacking their fellow team members, the security message was more powerful. Finally, we celebrated anyone who uncovered a hack with a company-wide announcement to keep the event top-of-mind and also incentivize awareness.
Setting up your own event
Structuring a month-long security event depends on your organization’s structure and culture. What works best for us will be different for you. We found that combining situational learning and an empathetic approach was a great foundation that anyone can build on. If you need some easy and effective hack ideas, we felt that these worked well for us:
Place “free” USB sticks around the office. You can test people’s situational awareness by leaving fake malicious USBs and seeing if they report these drives or start to use them.
Leave computers out and about. Back in 2012, 52% of all stolen corporate laptops happened in the work place. By leaving out spare laptops, we wanted to see if anyone would notice and try to find the owner. Now when there’s a laptop just lying around, people call it out.
Put a “Lock Your Computer Message” on unlocked computers. It’s easy to walk away from your desk and leave your computer unlocked, exposing sensitive work left for everyone to see. Anytime we saw an unlocked, unattended computer, we would stick a USB that would run a script that writes a “lock your computer” message.
Use fake social media accounts to phish. Security trainings typically overlook social media as a vector for phishing attacks. We created fake social media accounts, like on Twitter and LinkedIn, and posted or direct messaged spammy content.
Send out phishing emails. After our first round of phishing, we sent out an internal post with techniques for spotting fake emails. We repeated the campaign several times with different iterations and supported each attempt with education and training materials.
Security training shouldn’t be time-boxed to one month. Smaller red team activities throughout the year can continuously educate everyone about security risks, defenses, and reporting practices. Practicing blameless post-mortems and empowering our fellow team members made this event worthwhile. For us, this exercise has made everyone more cognizant of security issues, even if it’s made us a little more paranoid.
Do you enjoy solving difficult security problems with empathy and creativity? Come join our team! We’re hiring.
Host your own Hacktober was originally published in Points of interest on Medium, where people are continuing the conversation by highlighting and responding to this story.
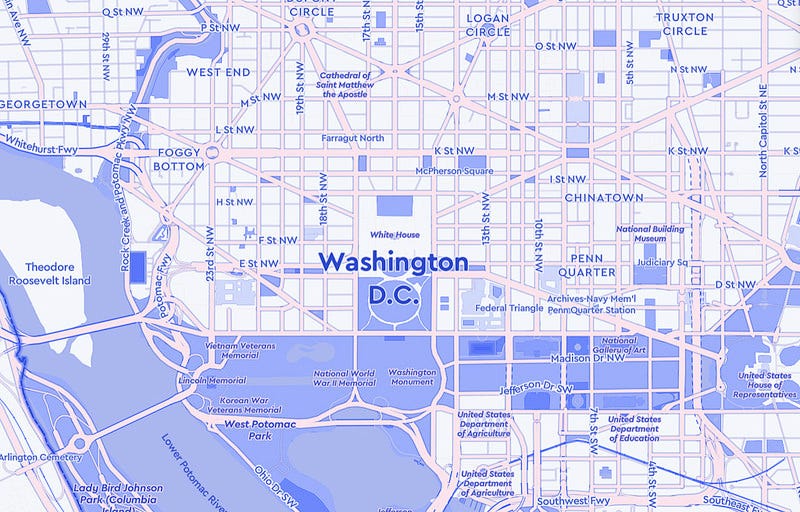
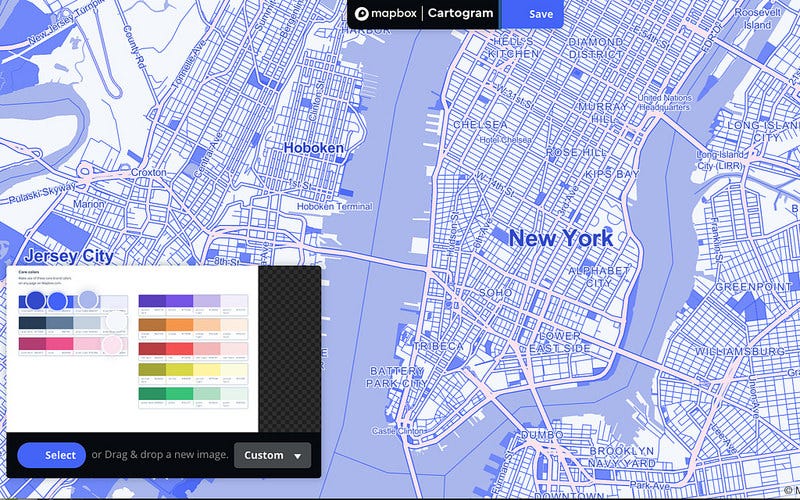
I made the map above in under 4 minutes with Cartogram and Studio.
Start by dragging a picture with your brand colors into Cartogram.
Next, use the preset filters (instead of Colorful, I used Light), or customize your color selection until you’ve created something you’re excited about.
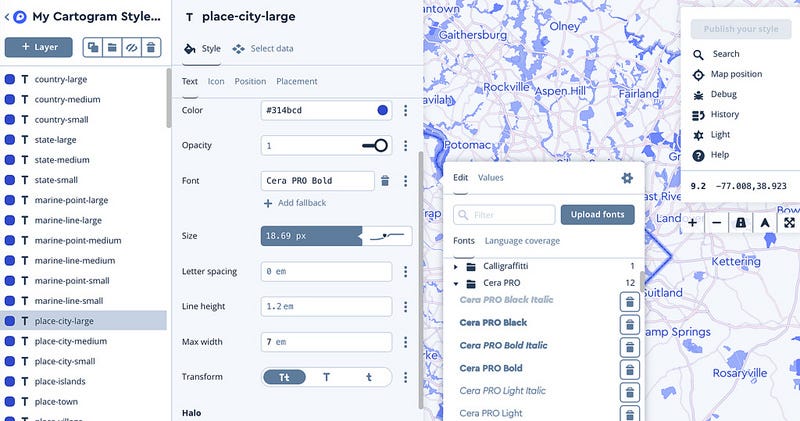
Once you have your style, save it and open it in Studio.
In Studio, you’ll have a pretty sweet map with all the layers in order for a basic map style. Change the fonts to match your brand and finesse a few areas like text-halo and road casings to perfect your map.
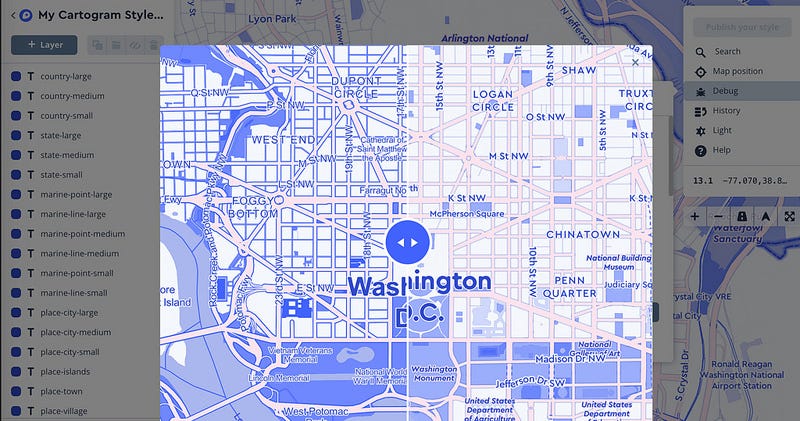
Take a look at my before and after, all done in under 4 minutes!
Start building your own map with Cartogram. Let us know on Twitter what you design using #BuiltWithMapbox.
Abhishek Arora came on board to build partnerships with the leading companies around the world for imagery, maps, POIs, and other geospatial data. Abhi joins us from Microsoft where he created alliances with aerial and satellite imagery companies for Bing Maps. Before Bing, he worked in the geospatial industry on engineering projects where he was a user of that data for over ten years. Abhi has a wealth of knowledge of the market that makes him a great fit for our growing needs.
Data is the fuel that runs our platforms and services. The output quality of those products is directly related to the quality of the data inputs. The geospatial data business is going through revolutionary change as customer demand for highly accurate, granular data drives new product offerings. Abhi will work closely with our product teams to develop strategies and build up our network of data partners to make those strategies happen.
You might catch Abhi running through the city in DC, playing cricket, or doing MMA. He is also a big fan of Bollywood movies. We are psyched to have him on the team.
Threshold 360 is building a library of immersive 360° imagery for public locations across the world — restaurants, shops, hotels, and more. Businesses and search directories use Threshold 360 to integrate this imagery into their digital properties; their users can search and explore places as if they are literally stepping in the door.
Threshold 360 customers can display imagery for multiple POIs on a custom Mapbox map style and build that map into their products. All of this content is viewable via desktop, mobile, and even VR.
In the example below, Experience Kissimmee highlights the best dining options at Disney Springs via a mashup of a Mapbox map and interactive 360° imagery. If you’ve ever found yourself wondering if a restaurant has the right “vibe”, this is a good way to get a sense of the space, ambiance, and the location, before committing.
In a study by Threshold 360 comparing time-on-page with a generic POI map vs. one with their interactive content, the Threshold 360/Mapbox map kept users on the page for 92% longer.
OpenStreetCam is a free and open platform to contribute street-level photos for improving OpenStreetMap. They’ve recently surpassed 100,000,000 photos with more being added every day.
We use photos like these to map traffic signage like stop signs, turn restrictions, exit numbers, and destination signs . All of this data improves OpenStreetMap as well as our maps and navigation tooling, which means more accurate ETAs, better instructions, and ultimately less time waiting in traffic.
I just released v2.5 of the iD editor, adding support for OpenStreetCam and also making it easier to use street-level photos from both OpenStreetCam and Mapillary.
The new iD editor
With hundreds of millions of photos, some locations have very dense coverage. iD previously tried to display a dot for every image, but now we simply show traces at low zooms. This makes the interface faster, easier to interpret, and it looks beautiful too.
The I-5 and I-90 interstates and the main roads of Seattle have great OpenStreetCam coverage.
Zoom in a bit further and we can see more details about the photos. Each photo is drawn as a circle, and individual traces are highlighted as the user mouses over them.
At medium zoom, we see photo locations and can highlight individual traces
At even higher zoom levels, we can see the directions that the photos were taken. We can also highlight a specific image in yellow and scale it up for better visibility.
Buildings, crosswalks, and street signs are visible in these photos.
The OpenStreetCam photo viewer includes buttons to step forward and backward in the photo sequence, as well as rotation buttons to adjust images that were uploaded in the incorrect orientation. You can see the name of the user who uploaded each photo and the date that the photo was captured.
Get Started
You can help! Smartphones and GPS enabled action cameras make it possible for anybody to contribute street-level photos to OpenStreetCam and view them right in the iD editor.
Follow me on Twitter for updates about the iD editor, or to chat about improving OpenStreetMap with street level photos. Also, check out the iD project on GitHub to make suggestions, contribute code and translations, and learn more about what we’re building next!
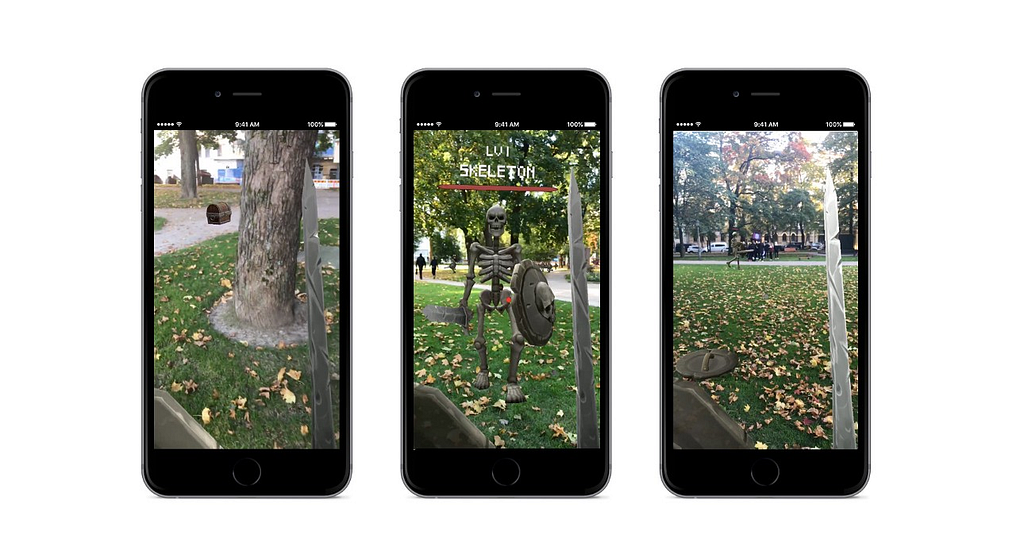
This is the second part of a two-part series on how to procedurally generate world-scale AR experiences using the Maps SDK for Unity.
In part 1 we highlighted an example using the SDK to procedurally generate game characters in any location marked “park” in the world; we then made them follow park pathways until the player approaches for battle. In part 2, we show you how to do this yourself.
What we’ll cover:
Setting up environment
Creating an advanced map
Setup scene
Let’s get going!
Setting up environment
We will be using components for the demo that require the experimental mapbox-arkit-unity build; this library is not the same as the standard SDK build. The repo comes with ARKit and runtime nav mesh components that are required to complete this tutorial. The tutorial also uses the latest SDK, v1.2. With the SDK, you can access not only maps, but also location intelligence metadata the lets you know things like “this location is a park,” “there’s a building here that’s 200 ft tall,” or “there is a grocery store 100 ft from you.” This data can be used to procedurally generate experiences at world scale.
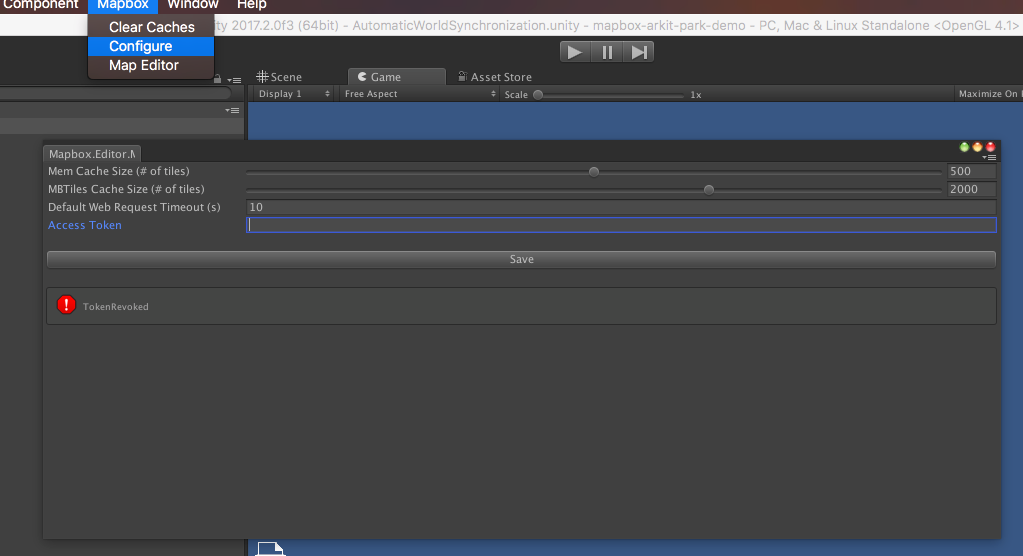
Remember to create a Mapbox Studio account; you will need an access token in Unity to fetch the map data. To activate a token in Unity go to Mapbox → Configure and paste the Access Tokento activate it.
Mapbox Configure menu in Unity.
To make sure things are working correctly, open up the AutomaticWorldSyncronization Scene and hit Play. You can find the scene from Assets → MapboxARScenes folder.
Creating an advanced map
If you’re not familiar with the Factory setup in the SDK, please see this tutorial on how to create factories for maps. Here are the steps needed to create our custom map — it’s a long list, but don’t worry, I’ll walk through each step in detail.
Create 2 Vector Layer Visualizers for Vector Tile Factory.
Create Modifiers for those two Vector Layer Visualizers.
Add the Modifiers to Modifier Stacks.
Assign the Stacks to Vector Layer Visualizers.
Assign Vector Layer Visualizers to Vector Tile Factory.
Assign Factories to Map Visualizer.
Let’s start with the Map Visualizer.
Map Visualizer
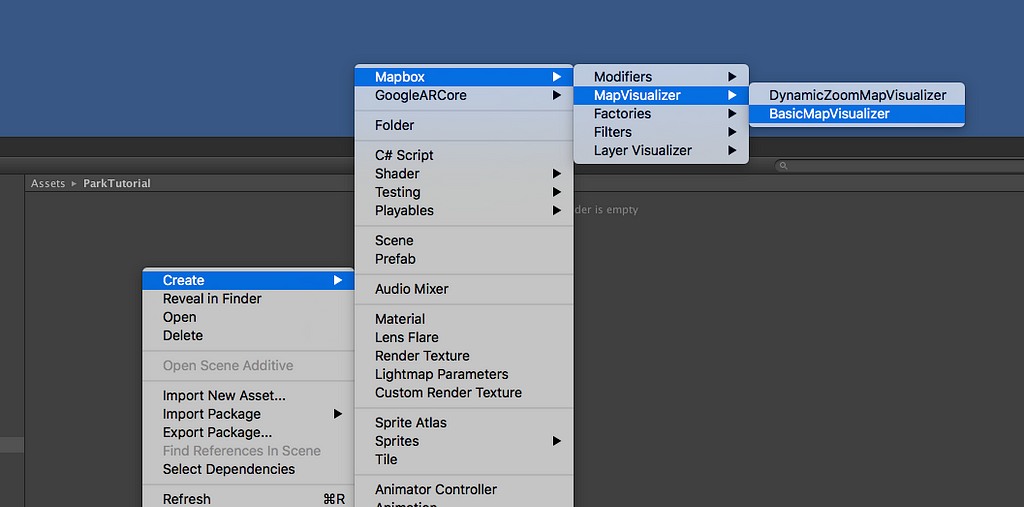
BasicMap Visualizer
Make a folder named ParkTutorial. Then create aBasicMapVisualizer and name it ParkMapVisualizer.
Right click to open up the Mapbox selection.
Factories
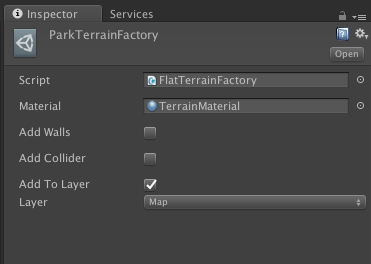
Flat Terrain Factory
While still in the ParkTutorial folder do the same process as above to create a Flat Terrain Factory. Mapbox → Factories → Terrain Factory — Flat. Name it ParkTerrainFactory. In the inspector assign the ParkTerrainFactory to Map Layer. Add a Map Layer if there is none. Also add Terrain Material to the Material property.
Flat Terrain Factory in the inspector.
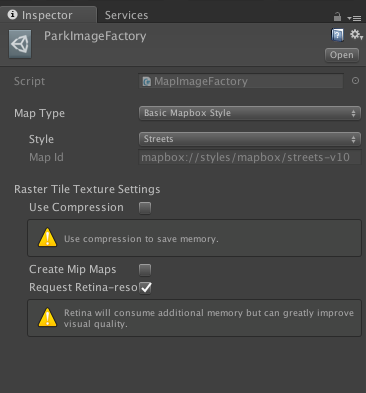
Map Image Factory
Create a new Factory Mapbox → Factories → Image Factory. Name it ParkImageFactory. Choose Map Style As Basic Mapbox Style and Style as Streets. Toggle Request Retina-resolution to get higher quality textures.
Map Image Factory in the inspector.
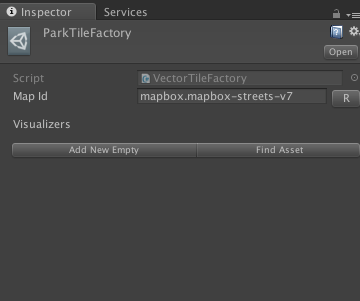
Vector Tile Factory
Create a Vector Tile Factory. Mapbox → Factories → Vector Tile Factory. Name it ParkTileFactory.
Vector Tile Factory will be holding all the Visualizers we need. Visualizers hold all the data we queue from Mapbox. If the Map Id is missing click “R” to add it.
Vector Tile Factory in the Inspector.
Vector layer visualizers
We need to create two Vector Layer Visualizers for our map and their modifiers, but first let’s create two extra folders in the ParkTutorial folder. Name them RoadLayer and ParkLayer.
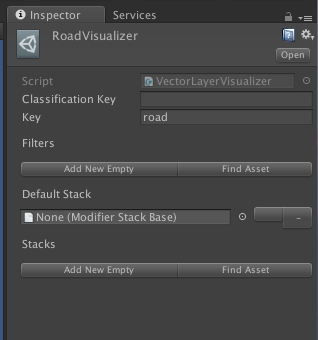
RoadVisualizer — Vector Layer Visualizer
In the RoadLayer folder Create → Mapbox → Layer Visualizer — Vector Layer Visualizer. Name it RoadVisualizer. For the Key property in the inspector type “road” .
Vector Layer Visualizer in the Inspector.
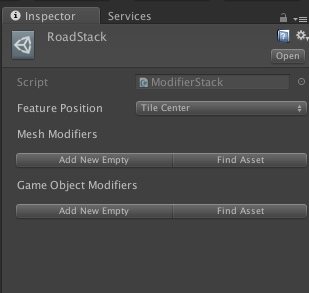
Modifier Stack for RoadVisualizer
Next, Create → Mapbox → Modifiers → Modifier Stack and name it RoadStack. We will be adding all our Modifiers to this Stack for our RoadVisualizer. For now, let’s keep it empty.
Modifier Stack in the Inspector.
Modifiers for RoadVisualizer
Time to create the modifiers we will be using in the RoadVisualizer.
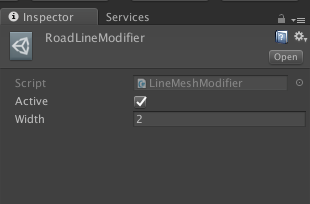
Line Mesh Modifier
Create → Mapbox → Modifers → Line Mesh Modifier. Name it RoadLineModifier. Add Width to 2.
Line Mesh Modifier in the Inspector.
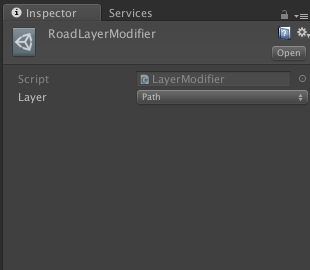
Layer Modifier
Create → Mapbox → Modifiers → Layer Modifier. Name it RoadLayerModifier. Assign the Layer Modifier to Path Layer.
Layer Modifier in the Inspector.
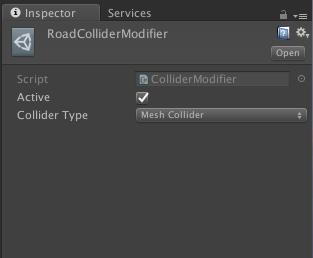
Collider Modifier
Create → Mapbox → Modifiers → Collider Modifier. Name it RoadColliderModifier. Make the Collider Type Mesh Collider.
Collider Modifier in the Inspector.
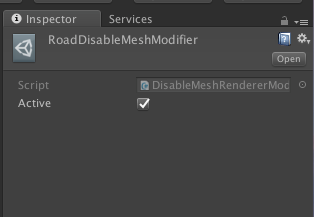
Disable Mesh Renderer Modifier
Create → Mapbox → Modifiers → Disable Mesh Renderer Modifier. Name it RoadDisableMeshModifier.
Disable Mesh Renderer Modifier in the Inspector.
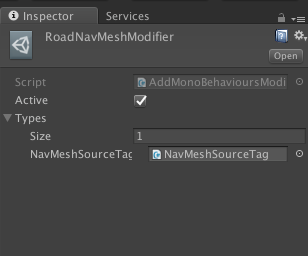
Add MonoBehaviour Modifier
Create → Mapbox → Modifiers → Add MonoBehaviour Modifier. Name it RoadNavMeshModifier. Make the array size 1 and add a NavMeshSourceTag to it.
Add MonoBehaviour Modifier in the Inspector.
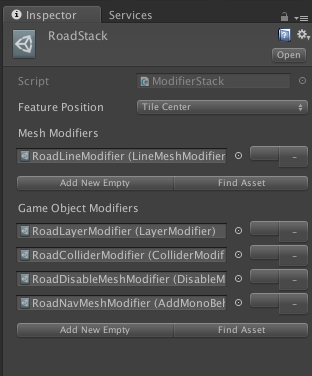
Add All Road Modifiers to RoadStack.
Next, assign all modifiers to the RoadStack we created earlier. After assigning everything it should look like this in the inspector.
RoadStack with Assigned Modifiers.
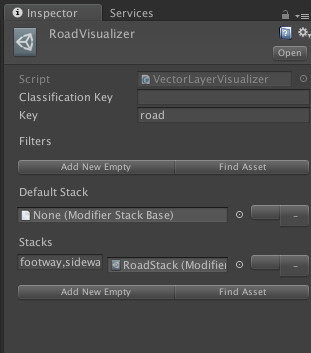
Add RoadStack to RoadVisualizer.
Open RoadVisualizer in inspector and click on Find Asset. Select the RoadStack from the module list. Next to the Modifier Stack type “footway,sidewalk,crossing”. The RoadVisualizer should look like this in the inspector.
RoadVisualizer in the Inspector.
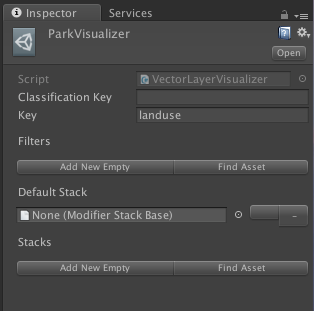
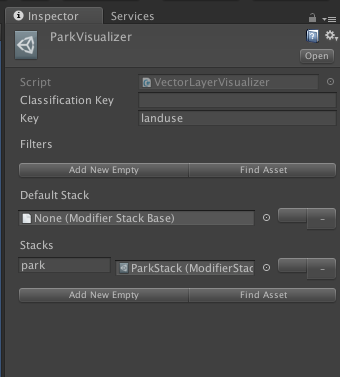
ParkVisualizer — Vector Layer Visualizer
Go to the ParkLayer folder and create another Vector Layer Visualizer. Name it ParkVisualizer. For the Key type “landuse”. We will add the Modifier Stack later.
ParkVisualizer in the Inspector. Without the Modifier Stack.
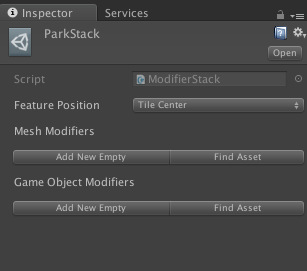
Modifier Stack for ParkVisualizer
Create → Mapbox → Modifiers → Modifier Stack. Name the Modifier Stack to ParkStack. As usual, we will assign the Modifiers to the ParkStack later on.
Unassigned ParkStack in the Inspector.
Modifiers for ParkVisualizer
Time to create the modifiers we will be using in the ParkVisualizer.
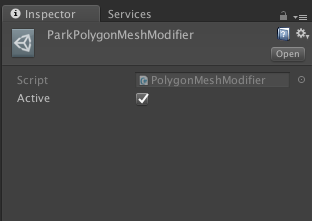
Polygon Mesh Modifier
Create → Mapbox → Modifiers → Polygon Mesh Modifiers. Name it ParkPolygonMeshModifier.
Polygon Mesh Modifier in the Inspector.
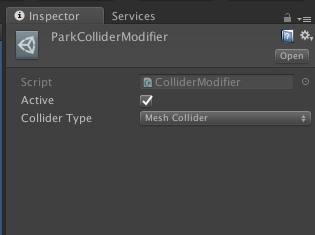
Collider Modifier
Create → Mapbox → Modifiers → Collider Modifier. Name it ParkColliderModifier. Make the Collider Type Mesh Collider.
ParkColliderModifier in the Inspector.
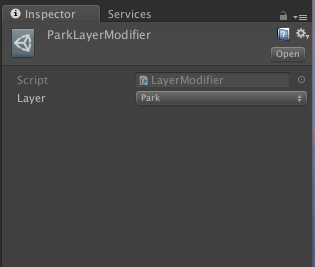
Layer Modifier
Create → Mapbox → Modifiers → Layer Modifier. Name it ParkLayerModifier and assign the Layer to Park Layer. If there is no park layer made create one by going to the top right side and clicking the tab Layers → Edit Layers and then add it. Remember to assign it to the ParkLayerModifier too.
ParkLayerModifier in the Inspector.
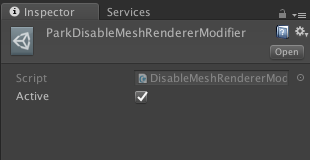
Disable Mesh Render Modifier
Create → Mapbox → Modifiers → Disable Mesh Render Modifier. Name it ParkDisableMeshRenderModifier.
ParkDisableMeshRendererModifier in the Inspector.
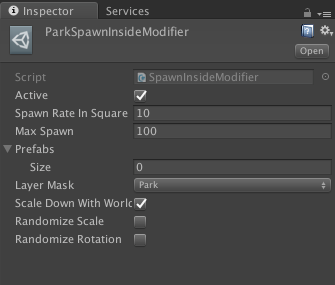
Spawn Inside Modifier
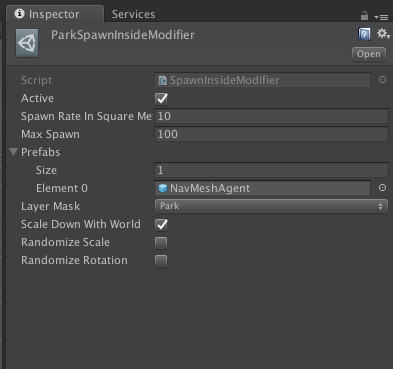
Create → Mapbox → Modifiers → Spawn Inside Modifier. Name it ParkSpawnInsideModifier. Set Spawn Rate In Square to 10 and Max Spawn rate to 100. Assign the Layer Mask to “Park“ layer. Set Scale Down With World to true.
ParkSpawnInsideModifier in the Inspector.
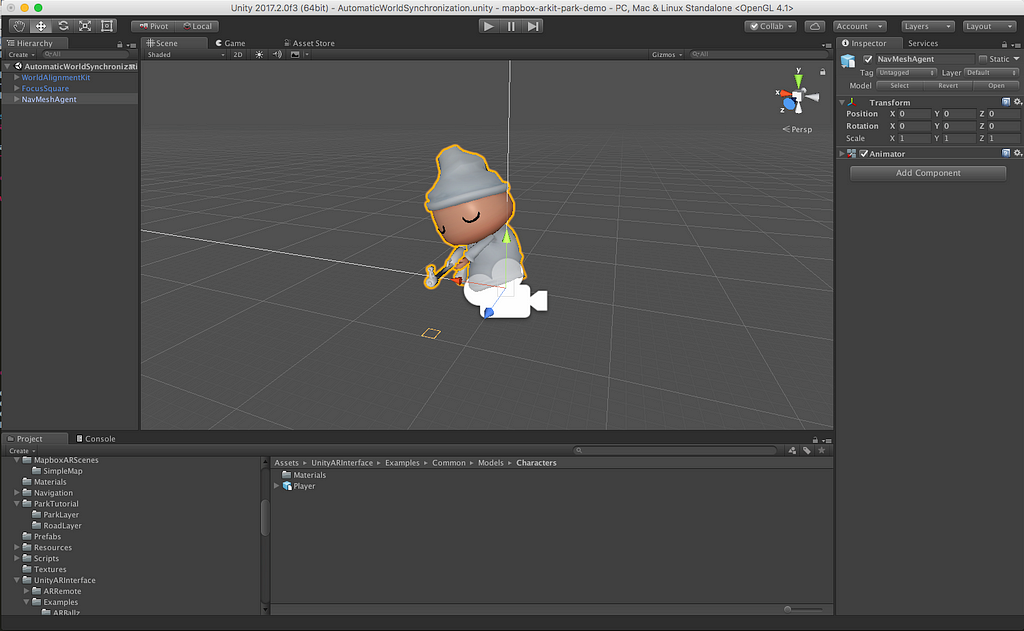
We need to add the NavMesh Agent to the SpawnInsideModifier. There is a nice Player prefab in the ARKit folder, so let’s duplicate the Player prefab from Assets > UnityARInterface > Examples > Common > Models > Characters. Drag the Player prefab on to the scene. Rename it to NavMeshAgent.
A Sleepy NavMeshAgent.
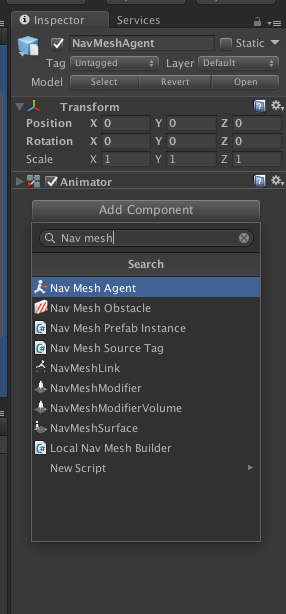
Select the NavMeshAgent gameobject and click the Add Component button from the Inspector to add a Nav Mesh Agent component to it by typing “Nav Mesh Agent” into the search bar and then selecting it. Assign the NavMeshAgent gameobject to AR Layer from the right top corner in the Inspector.
Nav Mesh Agent gameobject’s Inspector window.
Finally a little bit of coding! Create a new folder in Assets > ParkTutorial and name it Scripts. In the Scripts folder create a new script and name it ParkElement.
The script raycasts down to the map and checks if the gameobject hits a path in the park. Otherwise it destroys the gameobject. That way we will have only gameobjects spawning in to the pathways inside the park.
We will also need to write a script to randomize the agents destinations on runtime. So create a new script in the Scripts folder and name it RandomizeAgentDestination.
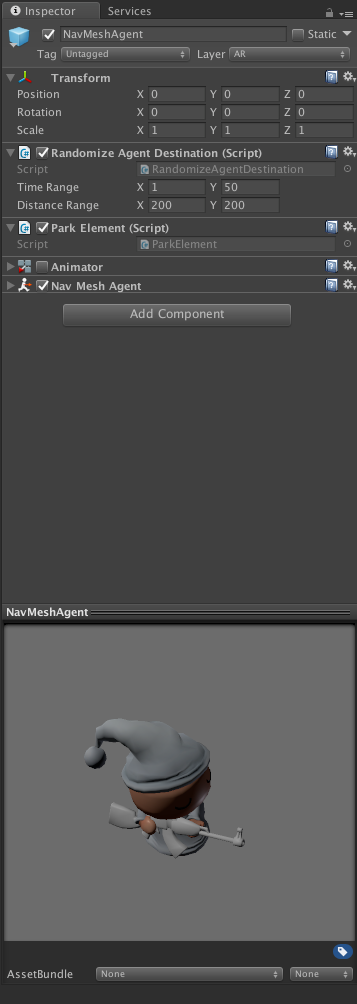
Add the ParkElement and RandomizeAgentDestination scripts to the NavMeshAgent gameobject and then drag and drop the NavMeshAgent gameobject to the ParkLayer folder. Finally add the NavMeshAgent to the ParkSpawnInsideModifier.
In the inspector of NavMeshAgent. Add to the Randomize Agent Destination values you wish. I added values on the to Time Range X: 1 Y: 50 and Distance Range X: 200 Y: 200.
ParkSpawnInsideModifier in the Inspector (left) | NavMeshAgent Prefab in the Inspector (right)
Add All Park Modifiers to ParkStack.
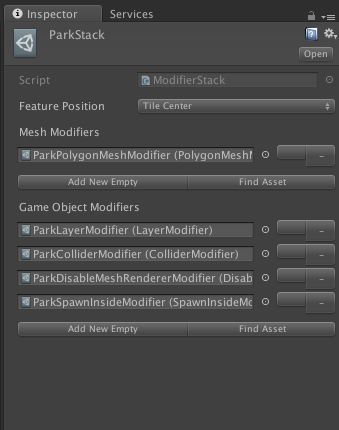
In Assets > ParkTutorial Click on the ParkStack to show the properties in the Inspector. Then click on Add New Empty to create a new slot for a Modifier. Assign the ParkPolygonMeshModifier to the Mesh Modifiers. Assign the rest of the modifiers to Game Object Modifier slots as seen below.
ParkStack in the Inspector.
Add Modifier Stack to ParkVisualizer
Click on Add New Empty on the ParkVisualizer in the inspector and select the ParkStack from the select module list. On the Stacks write “park”.
ParkVisualizer with the Added ParkStack in the Inspector.
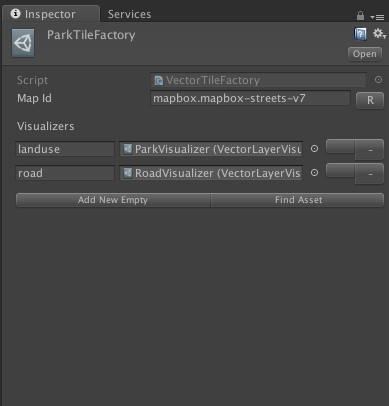
Assign Visualizers to Vector Tile Factory
In the Assets > ParkTutorial folder click on the ParkTileFactory. To create new slots for the Factory click on the Add New Empty button. Click on the Find Asset button and then select the ParkVisualizer & RoadVisualizer from the Select a module list.
ParkTileFactory in the Inspector after assigning Visualizers.
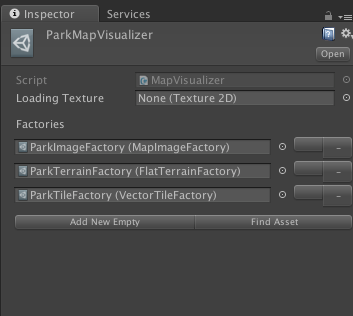
Assign Factories to Map Visualizer
Assign the ParkImageFactory, ParkTerrainFactory and ParkTileFactory to the ParkMapVisualizer in the inspector. Click on on the Find Assets and then choose the Factories one by one.
ParkMapVisualizer in the Inspector.
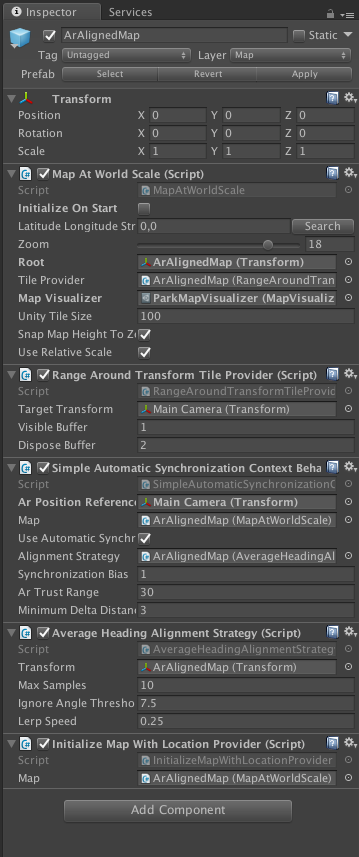
Setup scene
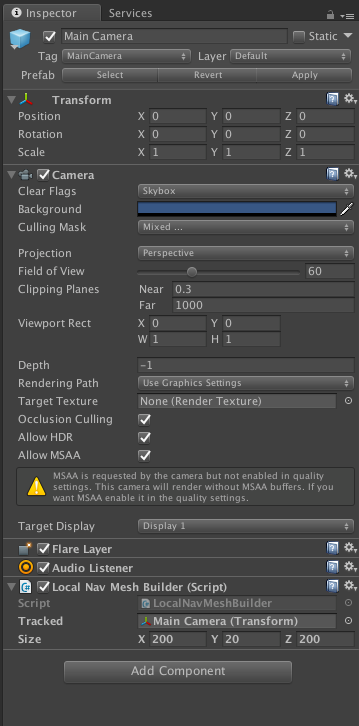
In the AutomaticWorldSynchronization scene go from the hierarchy to WorldAligmentKit → ArAlignedMap and change the Map Visualizer to ParkMapVisualizer. In the Range Around Tile Provider script assign the Target Transform to the Main Camera. Main Camera is located as child in AR Root.
ArAlignedMap in the Inspector.
Add a Local Nav Mesh builder to the Main Camera in the scene.
Set It’s Size to X: 200, Y:20, Z: 200.
Main Camera in the Inspector.
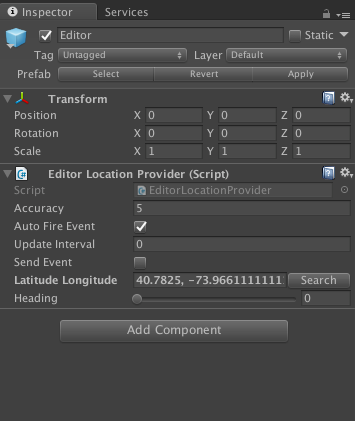
To set the map location to start at a park in the editor. Go to LocationProvider gameobject and select the Editor childobject and type copy these coordinates 40.7825, -73.966111111111.
Editor gameobject in the Inspector.
Voila! Everything should be set up. Press play and witness NavMeshAgents roaming in New York Central Park. If you move the AR Root gameobject around the map will update tiles accordingly.
Nav Mesh Agents roaming in Central Park, New York.
Give yourself a pat on the back, you deserved it after completing this tutorial!
Keep building
Leverage geospatial data in AR/VR applications with the Maps SDK for Unity. Give this project a test run in AR and customize it to your needs. You can also create your own custom tilesets in Mapbox Studio that can then be accessed in Unity. Let us know what you build on Twitter with the tag #BuiltWithMapbox.
Entry fees to national parks may soon see a sharp increase. In an effort to finance a backlog of repairs and improvements to parks, the National Parks Service recently proposed fee increases for 17 of the most visited national parks. The service is considering increases for both peak season and regular season pricing.
For some parks this increase is negligible, but for others, fares could more than double. To better understand the impact on park visitors, I created a map highlighting each affected park. Try using the map to understand the potential cost of your next trip; explore the fee hikes based on season and entry method to the park (motorcycle, bike, personal car, or by foot).
The NPS proposed these fee increases to generate revenue for overdue repairs to park infrastructure and to make improvements to the parks. The service estimates that this fee structure could increase revenue by 34 percent, bringing the total potential revenue to $270 million compared to the $200 million collected in 2016.
While it will remain free to enter these parks if you are under 16 years of age, or if you hold a Senior, Military, Access, or Volunteer pass, park-goers should expect to see peak season fees roughly double what they would pay now.
That said, this only affects 17 of the 118 national park sites currently charging entrance fees. The remaining 299 free parks will not be affected.
Behind the design
To build this map I altered our outdoors style, lightening the shade of green used in shading the national parks and increasing the opacity of contour lines starting at a zoom level of six, rather than 11. This makes the national park boundary overlays pop a bit more against the background and also emphasizes the topography in the parks.
The data for the national park boundaries comes directly from the National Park Service, downloadable as a shapefile that I then converted to GeoJSON using ogr2ogr; I filtered it to only include the affected parks. After converting and filtering this park data, I added it as a layer in my GL JS map.
Have an opinion on the proposed price increases? The NPS is taking public comments from now through November 23, 2017. Head to their forum to submit your thoughts, then try creating your own interactive map using GL JS.
With the new Mapbox GL heatmaps you can add powerful map data visualizations to your applications with minimal code. Integrating our maps natively, keeps your customer data private and allows you to control the entire experience for users.
You can customize every aspect of the data visualization and see trends in any data property, even when working with large datasets. Our heatmaps can also integrate with other developer tools, so you can maintain your workflow without relying on third party solutions.
Create fast maps with millions of points
Create heatmaps from massive telemetry, web traffic, and social media data. Real-time adjustments to color transitions, filters, and other style properties are performant at scale. Try it yourself with this map of automobile telemetry data across London.
See trends in any data property
With our heatmaps you can do spatial data aggregations to quickly understand average, minimum, and maximum trends, like this example of home insurance values and property aggregation. Users can interpret data at the state level down to individual homes. Explore the full map.
Stay within your workflow
Data scientists face many of the same challenges as BI developers, often exporting data into a third-party data viz tool. Using Mapbox, stay within your own data science workflow, like integrating our heatmaps with Jupyter notebooks: