Breaking down the New York Times Map of Every Building in America
By: Lo Bénichou
This weekend, a Mapbox map was on the front page of the New York Times. If you haven’t seen the stunning Map of Every Building in America it truly is a feast for the eyes. The Sunday print edition featured a four-page-wide map of one of six metropolitan regions, and the online version of the story enables readers to zoom in on black-inked building footprints everywhere in the United States.
Why building footprints? The New York times saw this as an “opportunity for [the reader] to connect with the country’s cities and explore them in detail. To find the familiar, and to discover the unfamiliar.” The effect is an almost artistic look of community design and development across America, showcasing how geography, politics, culture, or the economy have shaped our cities, suburbs, and towns.
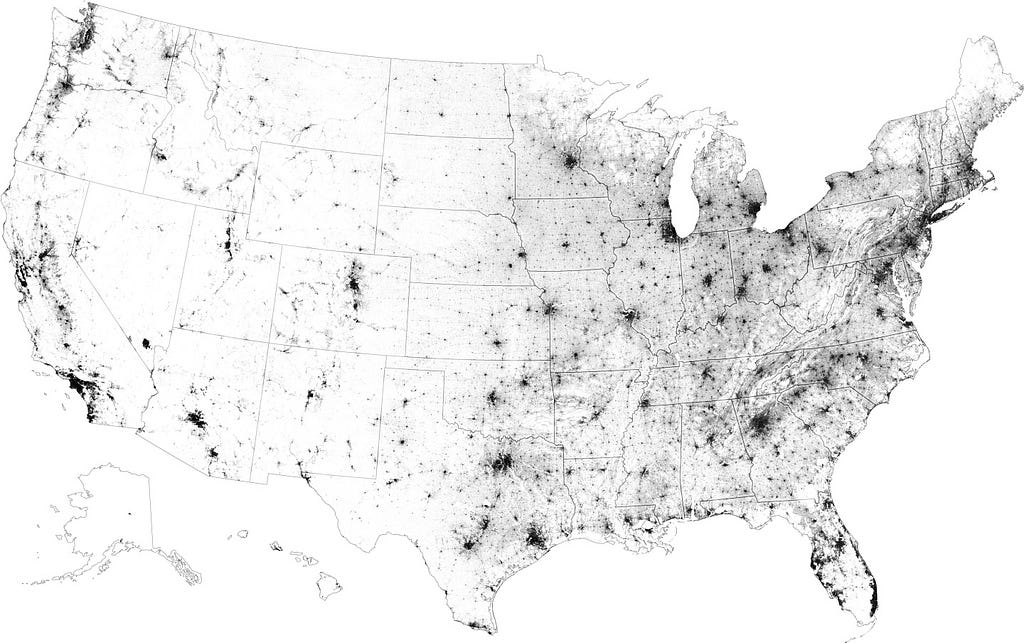
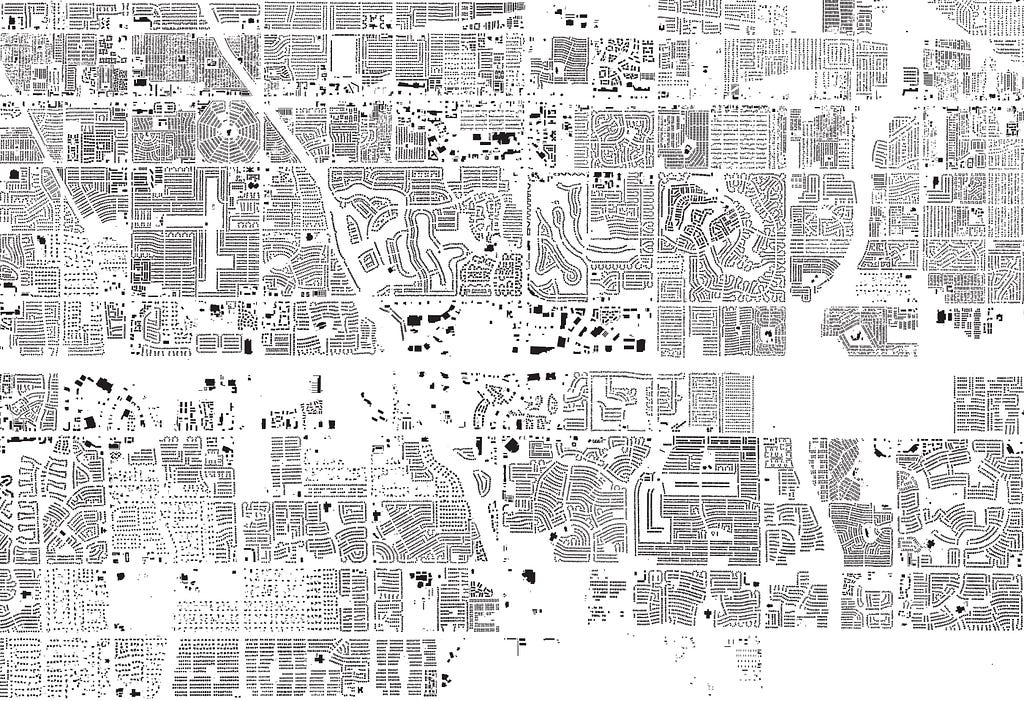
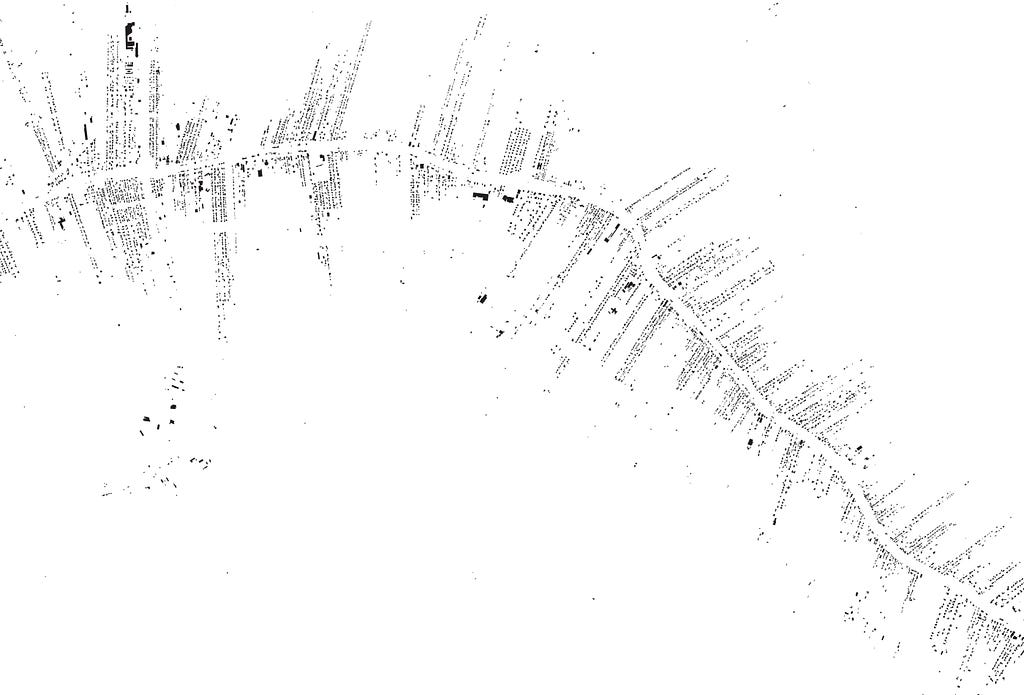
The beauty of this map also lies in the fact that the footprint data is available for anyone to use and play with. The New York Times mostly used building footprints from Microsoft (built with machine learning from satellite imagery) and stitched it all together using tippecanoe to produce visually imposing interactive map.
Let’s look at how to reproduce a similar map using building footprints for California. You can download the data here. The GeoJSON is fairly large (2.67GB for California alone), which is where tippecanoe comes in handy.
The trick is to only show certain features at specific zoom level. You can specify a max zoom or a minimum zoom or you can use -zg to automatically choose a maxzoom that should be sufficient to produce clear features and details within them. We also need to exclude all properties, if any, using --exclude-all. This will significantly reduce our file size. Now, building footprints are very dense. Using --drop-denset-as-needed will drop any features that isn’t visible are low or medium zoom level. Here is the full command:
tippecanoe -o california-buildings.mbtiles — layer=buildings -zg — drop-densest-as-needed — exclude-all California.geojson
This should take a while, but once it has processed the GeoJSON into MBtiles, you can use mbview.
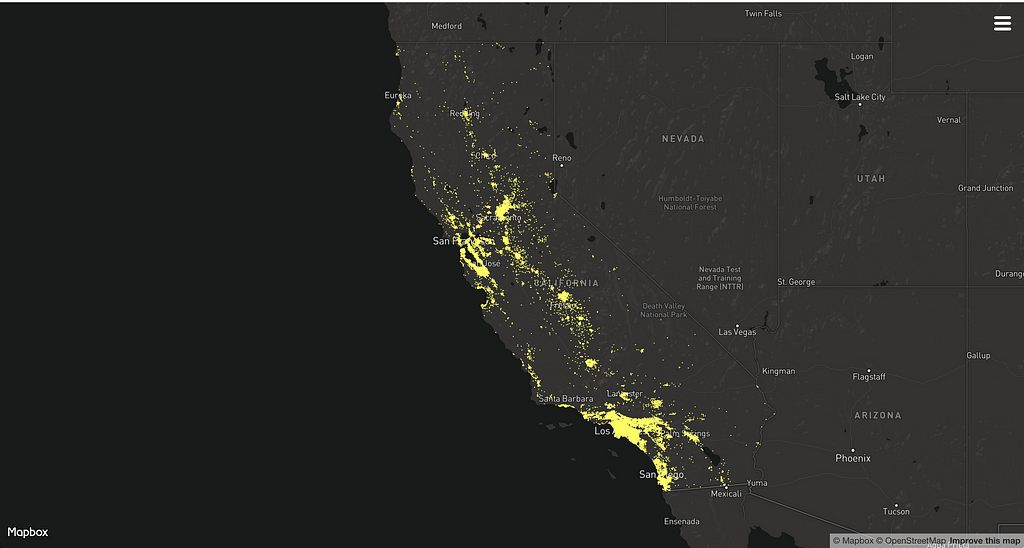
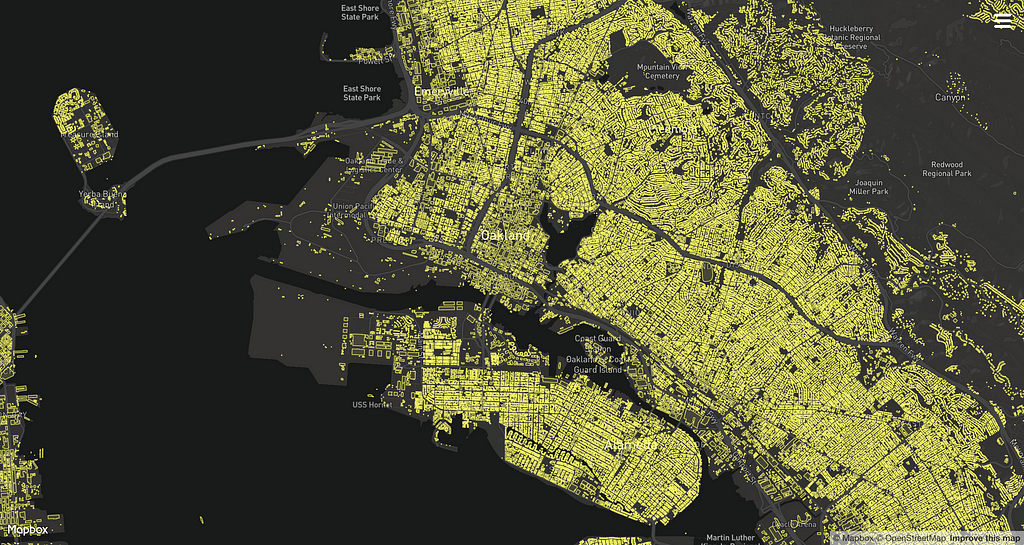
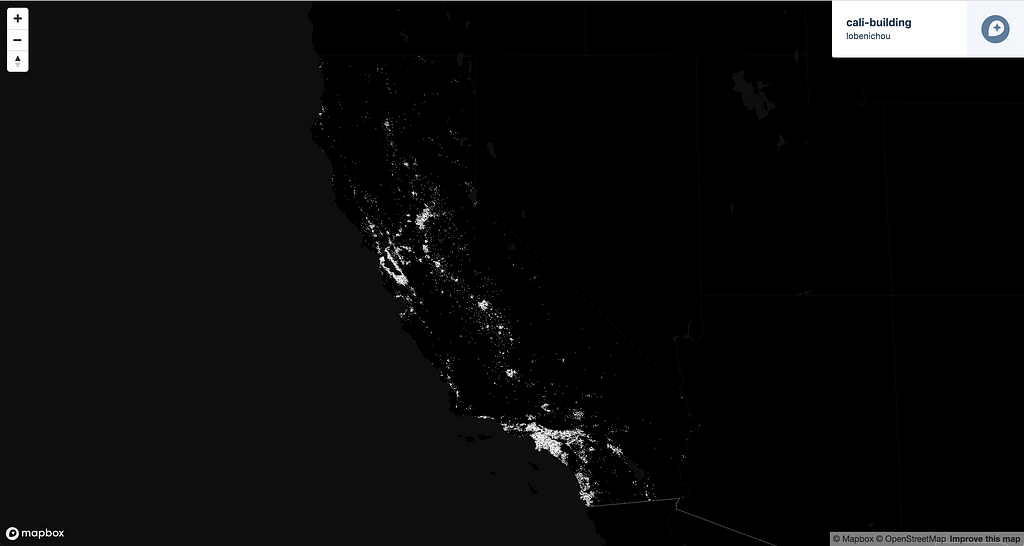
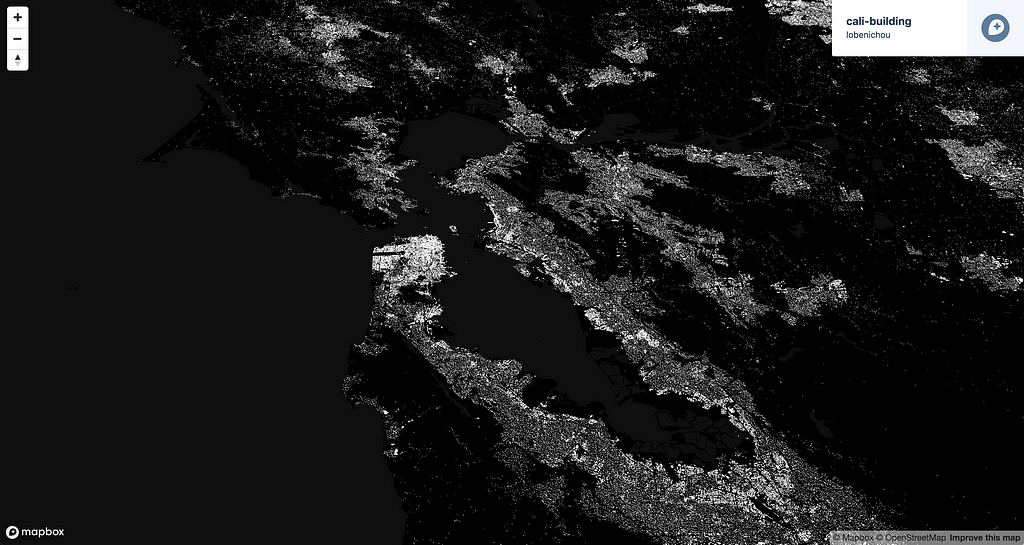
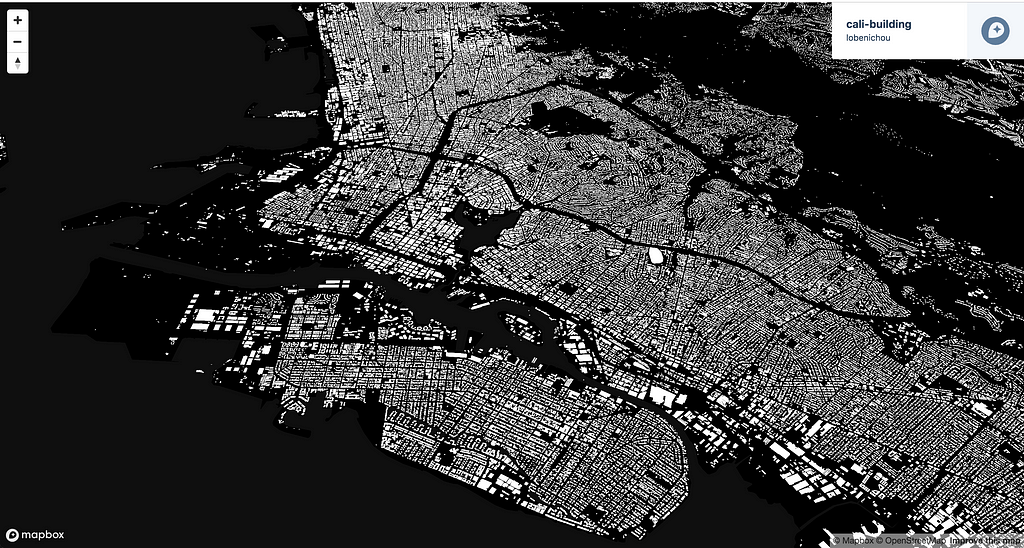
Now, let’s see what we can do with this tileset in Studio. You can start with a blank style but I decided to use our Decimal designer style. I removed unwanted layers like roads and low zoom labels. For the buildings to pop, the style should feel uncluttered. Then, I uploaded my MBtiles file into Mapbox and styled it. Here are the results:
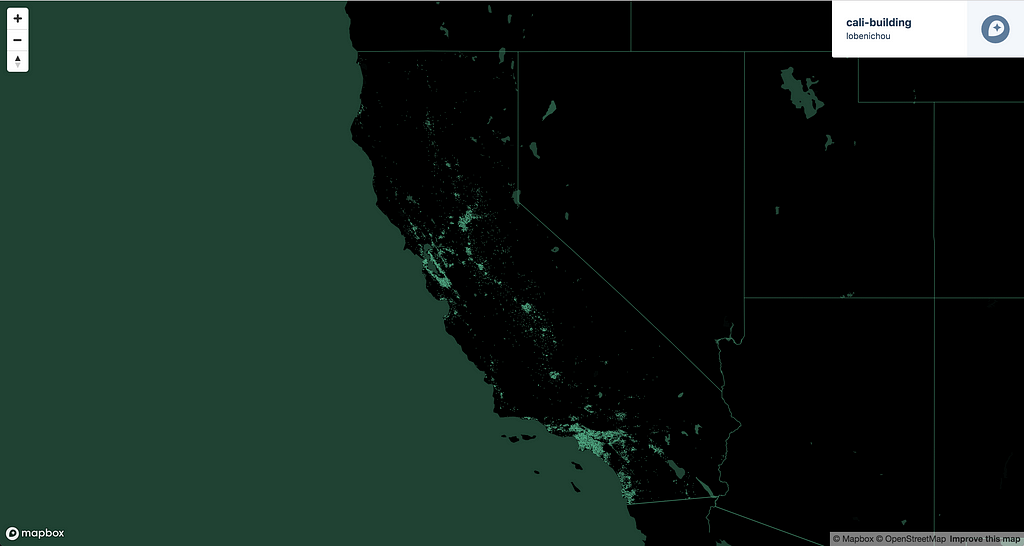
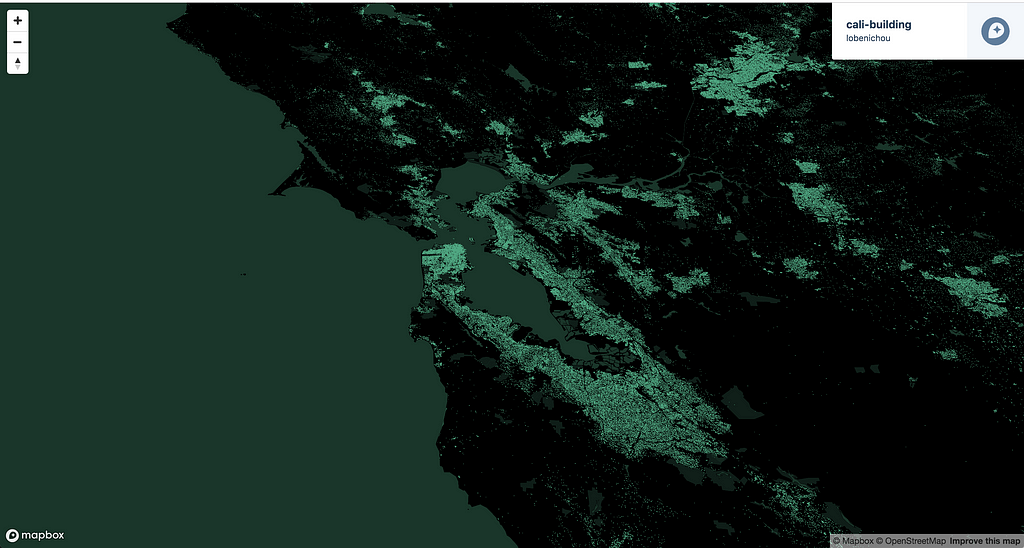
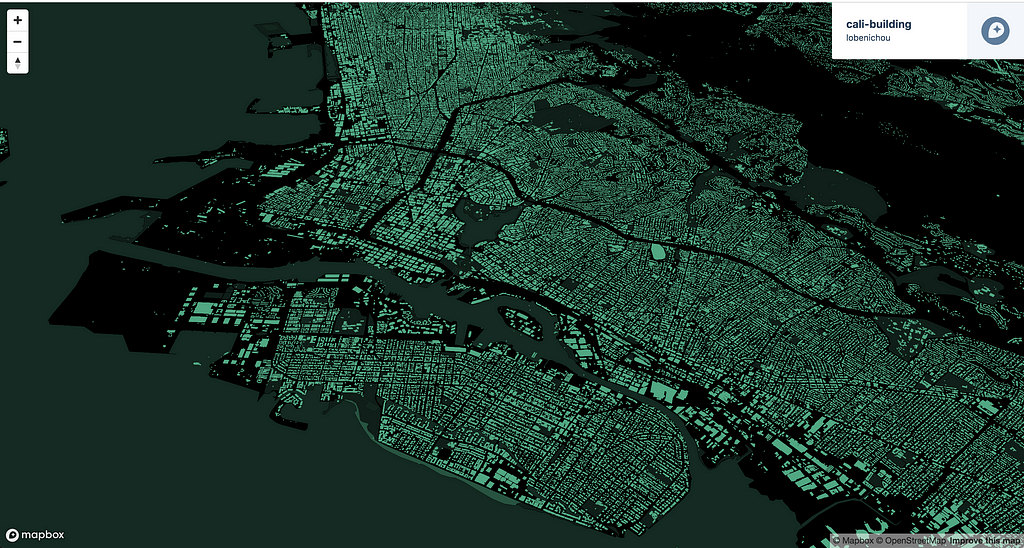
You can also play around with the contrast and colors to create a city lights effect:
But let’s give credit where credit is due. While the above seems relatively simple, this process only involved data from one state and the details aren’t perfect.
Creating the Times’ beautiful, accurate visualization of every building in America is a major task that required incorporating additional data, lots of time spent on finer details, a lot of adjustments using tippecanoe… and a lot of patience. The result was certainly worth the effort.
Building with building footprints was originally published in Points of interest on Medium, where people are continuing the conversation by highlighting and responding to this story.