Six new features for the Mapbox Visual for Power BI
By: Sam Gehret
Clik here to view.
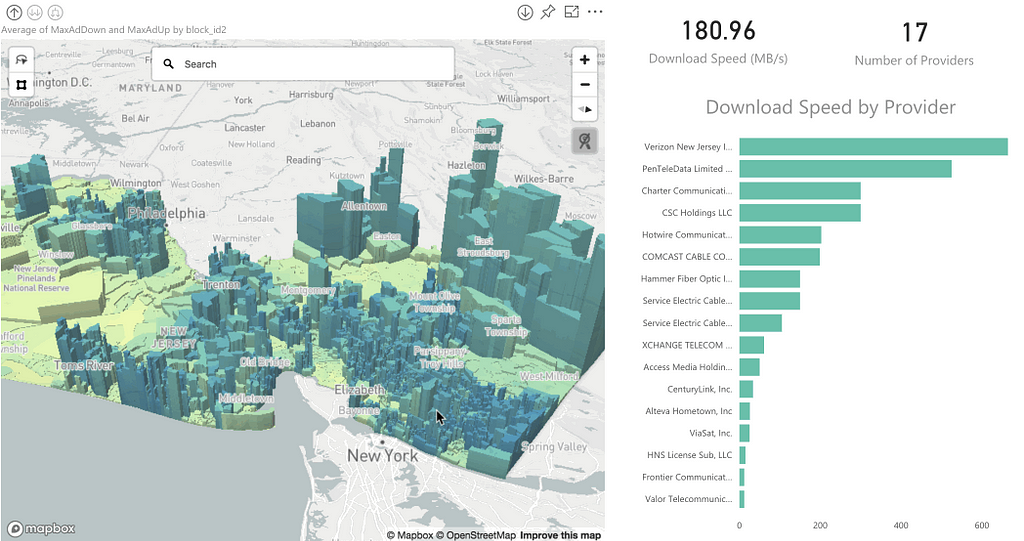
We’ve just released an enhanced Mapbox Visual for Power BI, which adds our maps and visualization tools directly to Microsoft Power BI.
We’ve received amazing feedback from the PowerBI community since Jul, when we released support for fill layers, custom polygons, and drill-downs. Based on that feedback, we’ve continued improving the functionality and user experience of our visual.
Here’s a rundown of the top new features:
3D extrusions on fill maps:
Add an extra dimension to your fill visualizations by using 3D extrusions. In addition to data-driven coloring of polygons, users can now add data-driven heights to these polygons as well. Just drop a metric into the “size” dimension and set your relative “extrusion height.”
Clik here to view.
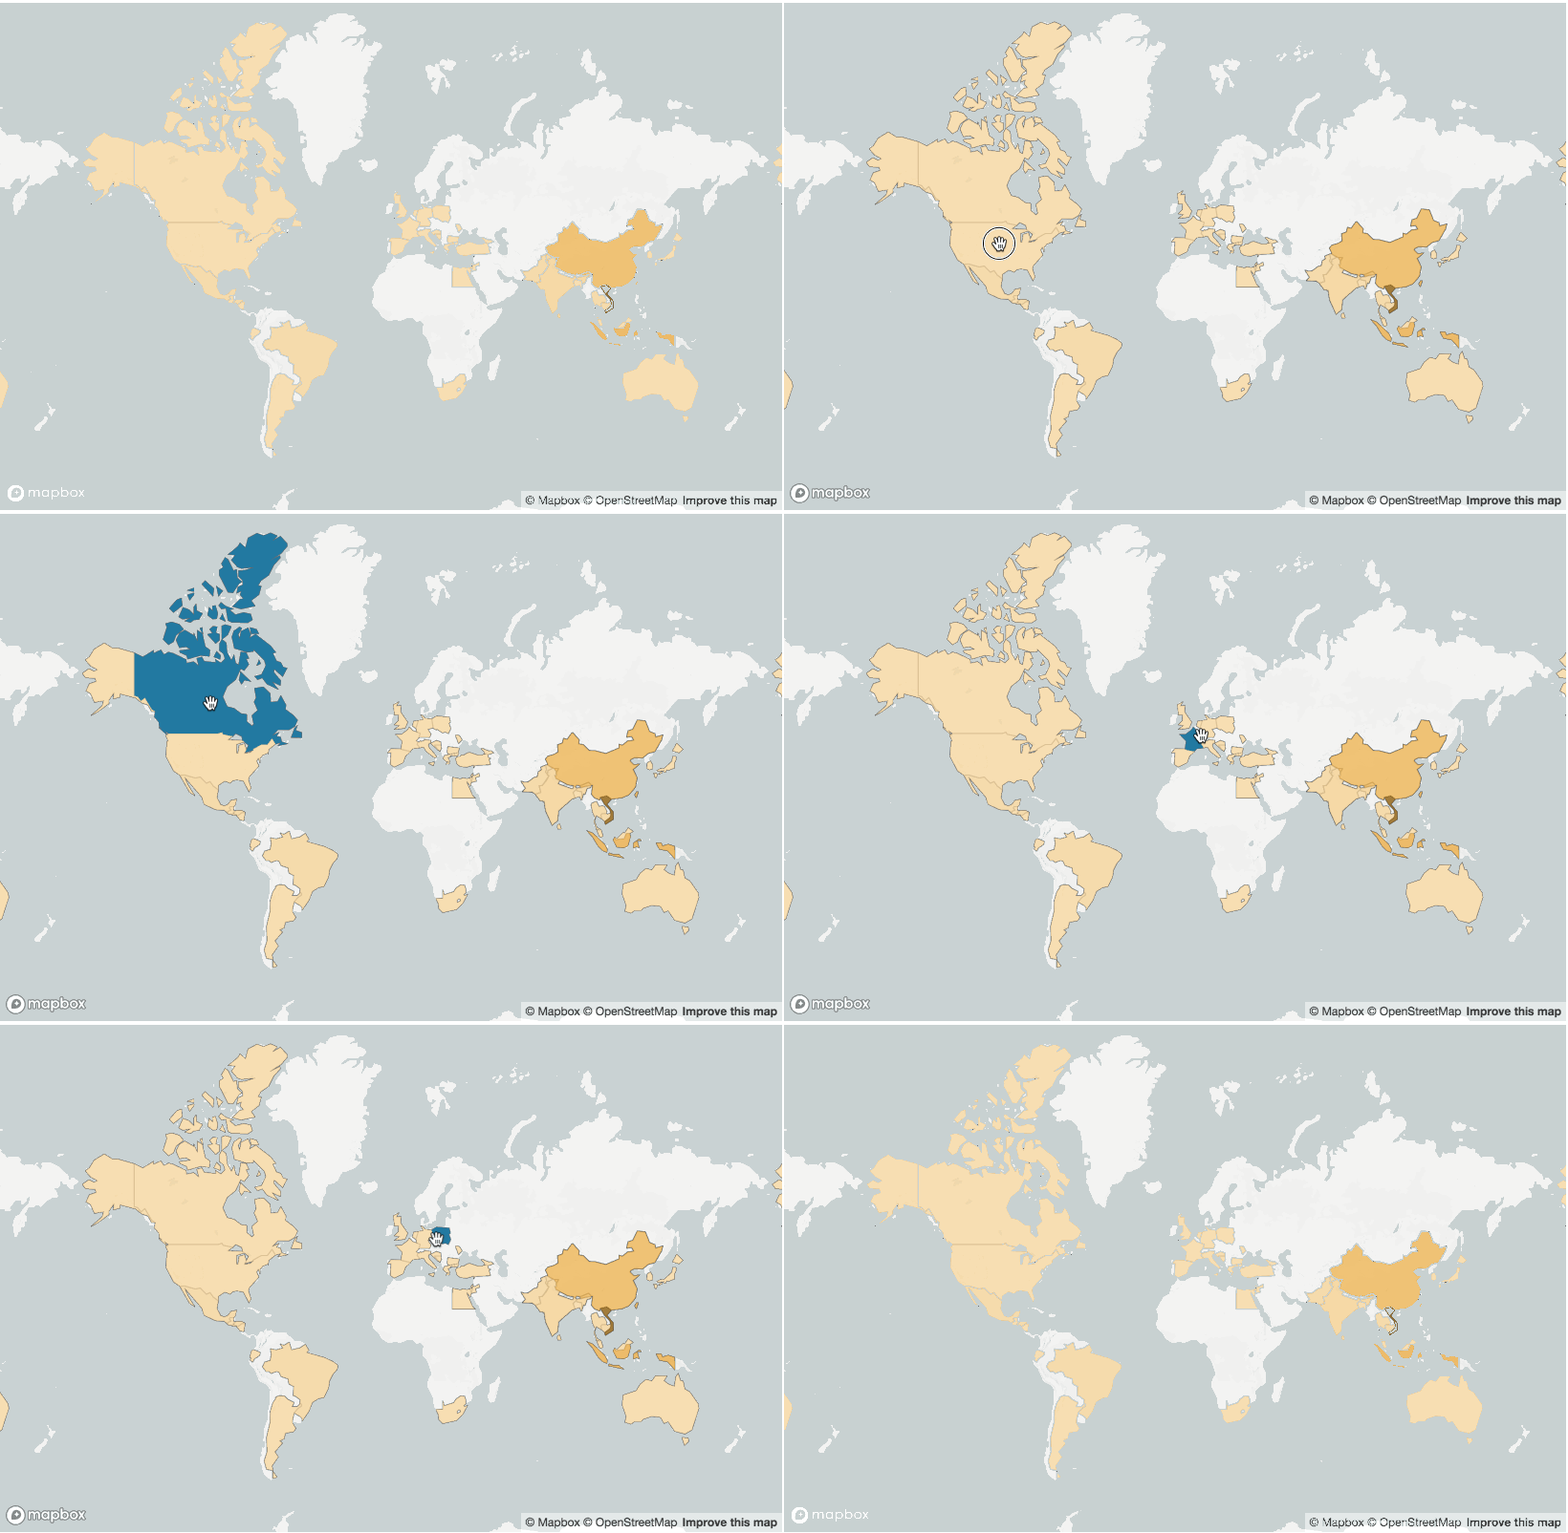
Autozoom to selected shapes
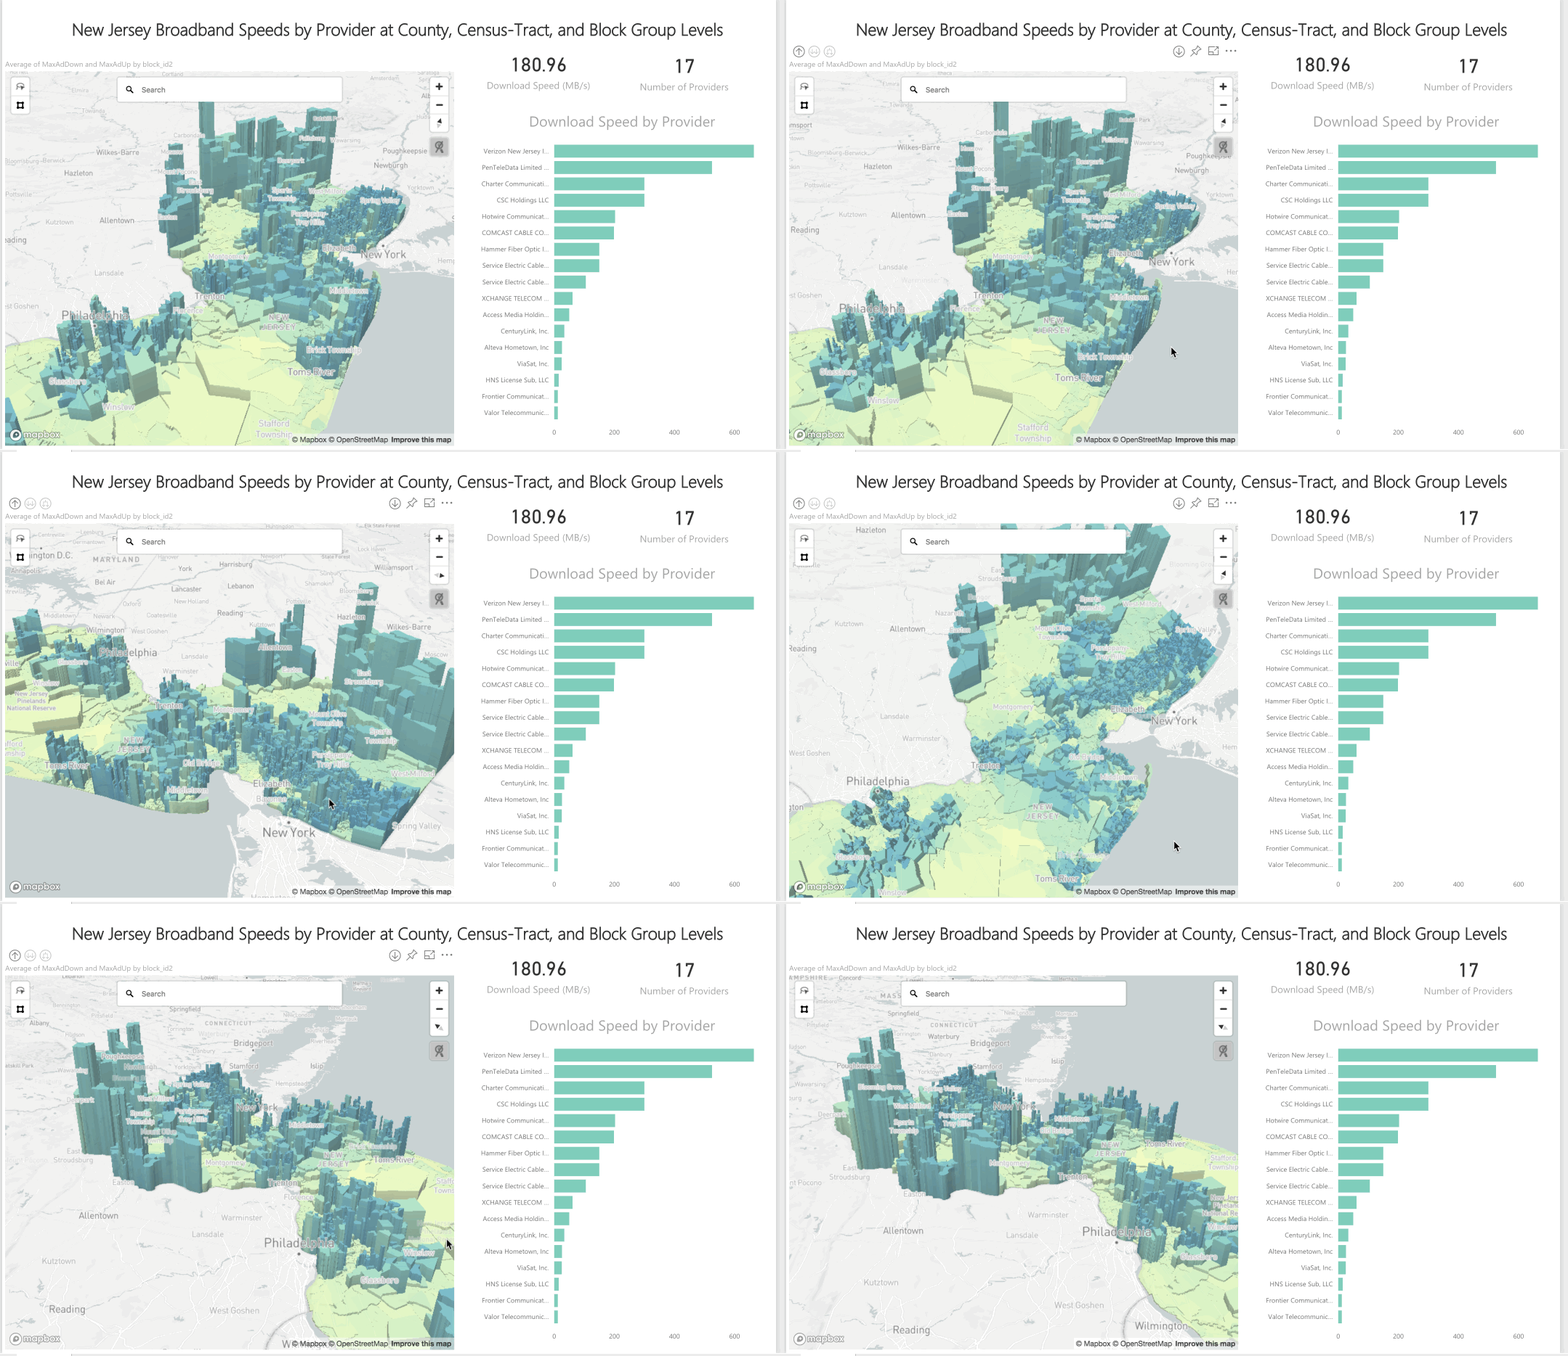
One of our most requested enhancements is now a feature — when filtering your fill maps, the map will auto zoom to the rendered shapes on the map.
Clik here to view.
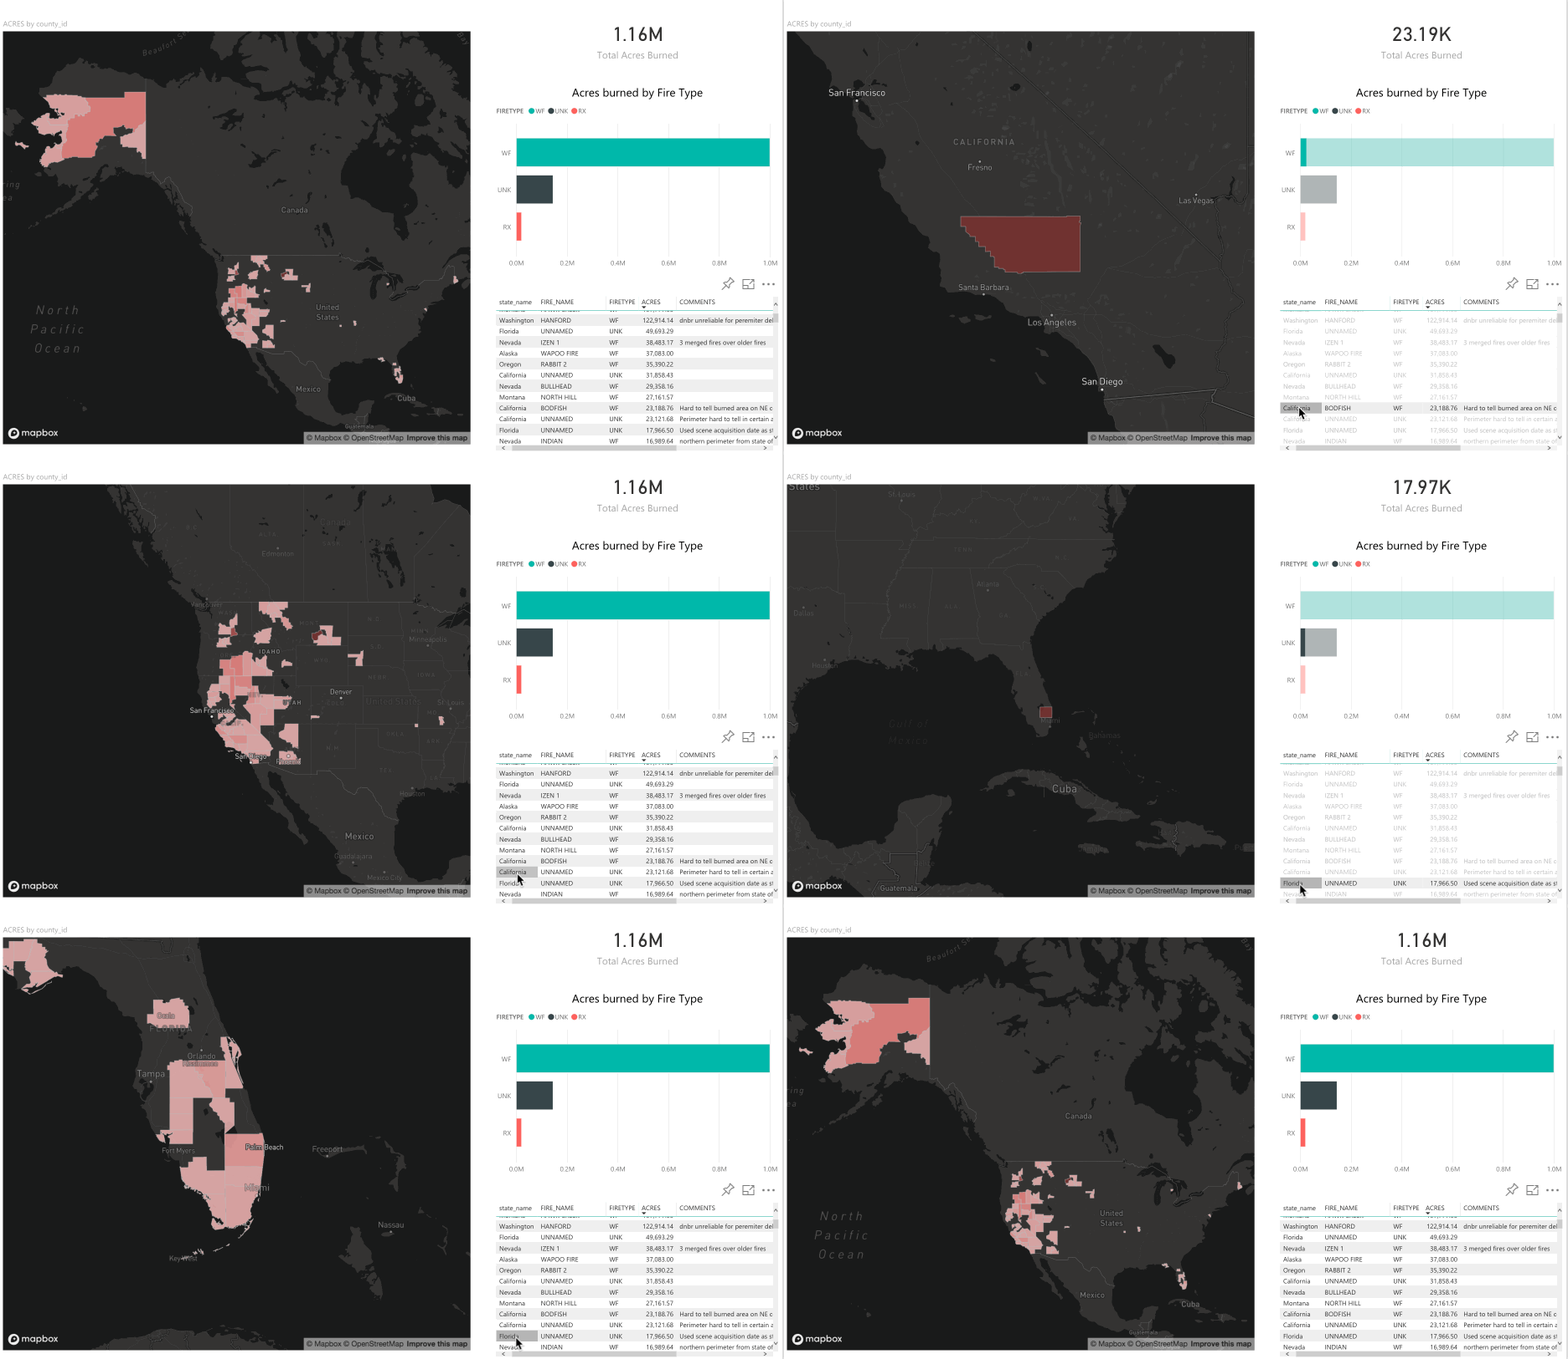
Set a default map pitch
With 3D extrusions, it is usually necessary to apply a pitch to the map in order to get the most context around polygon heights. We have introduced a simple option to set the default map pitch.
Disable map controls
For those users who are looking for a bit more real estate on the map or have no need for the map controls (buttons for zooming and selecting), you can now hide these controls.
Clik here to view.
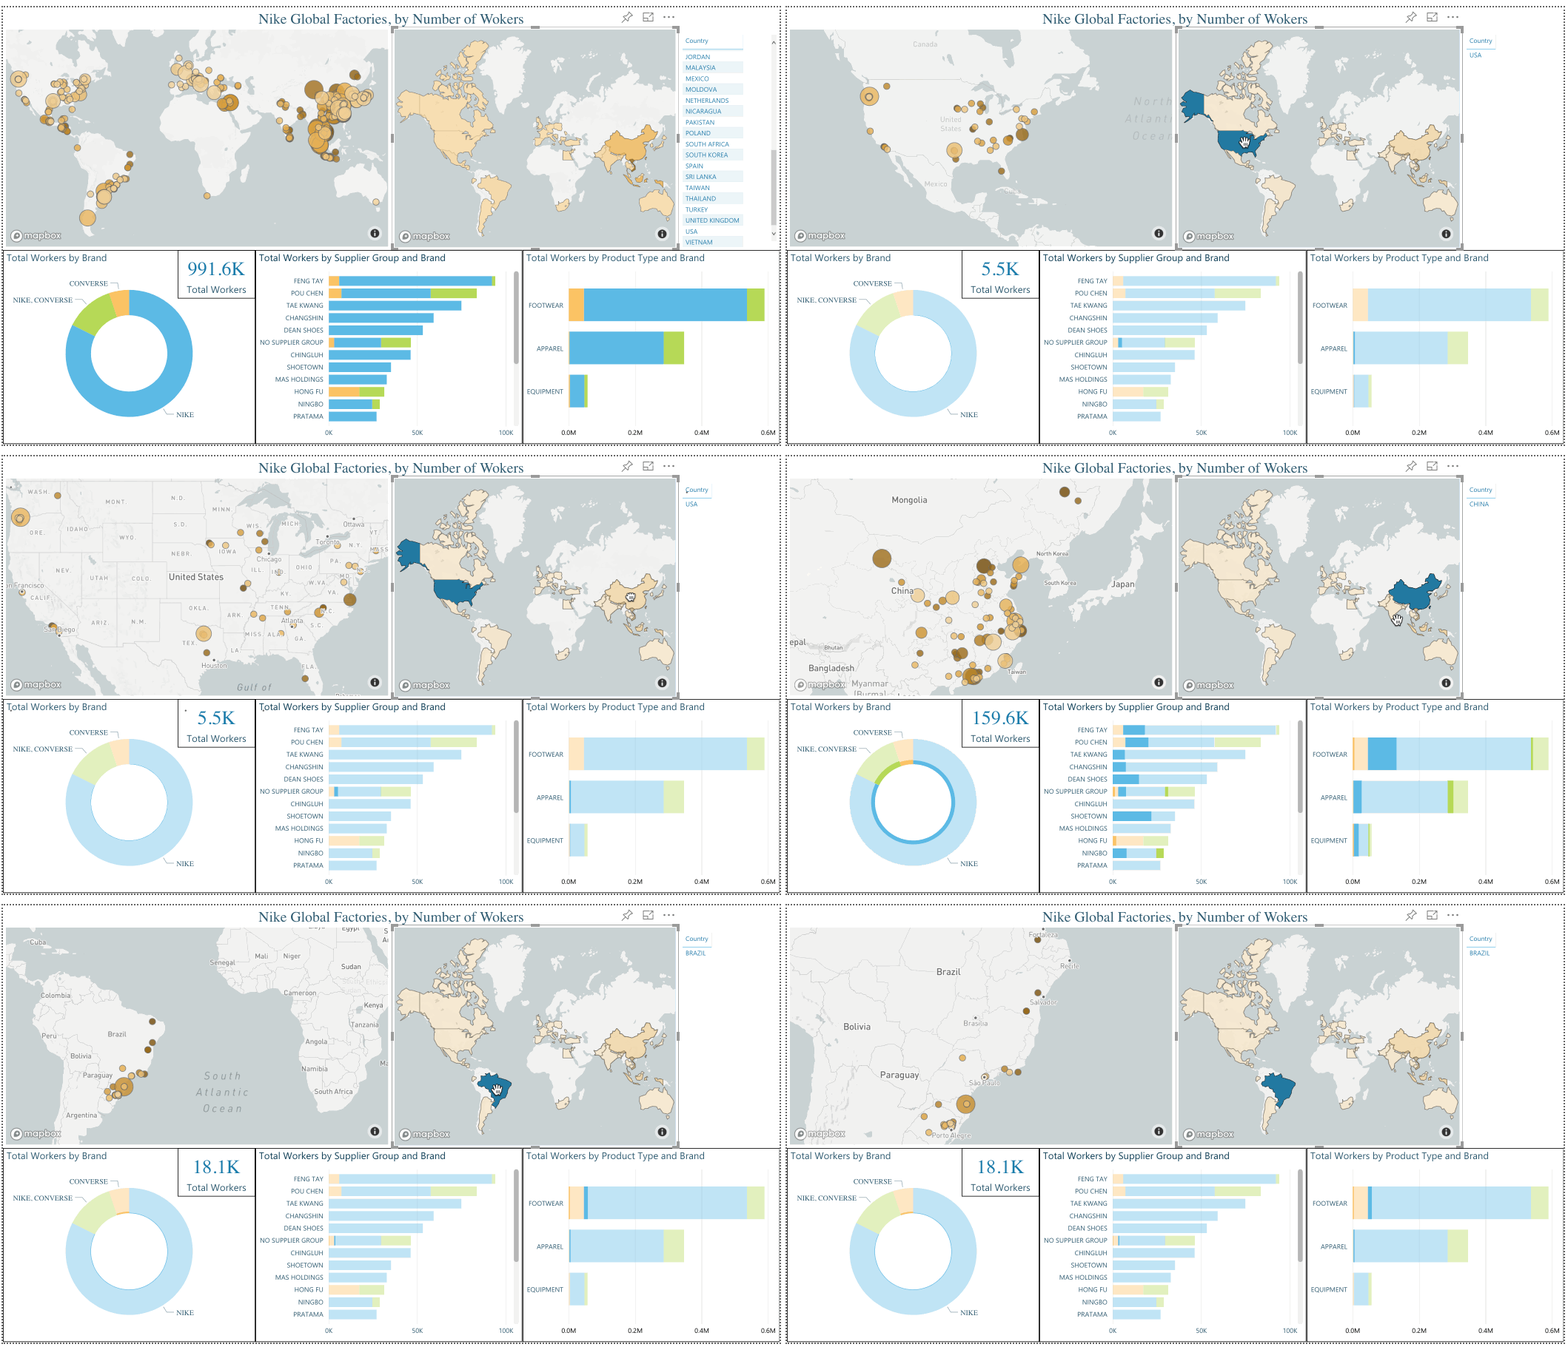
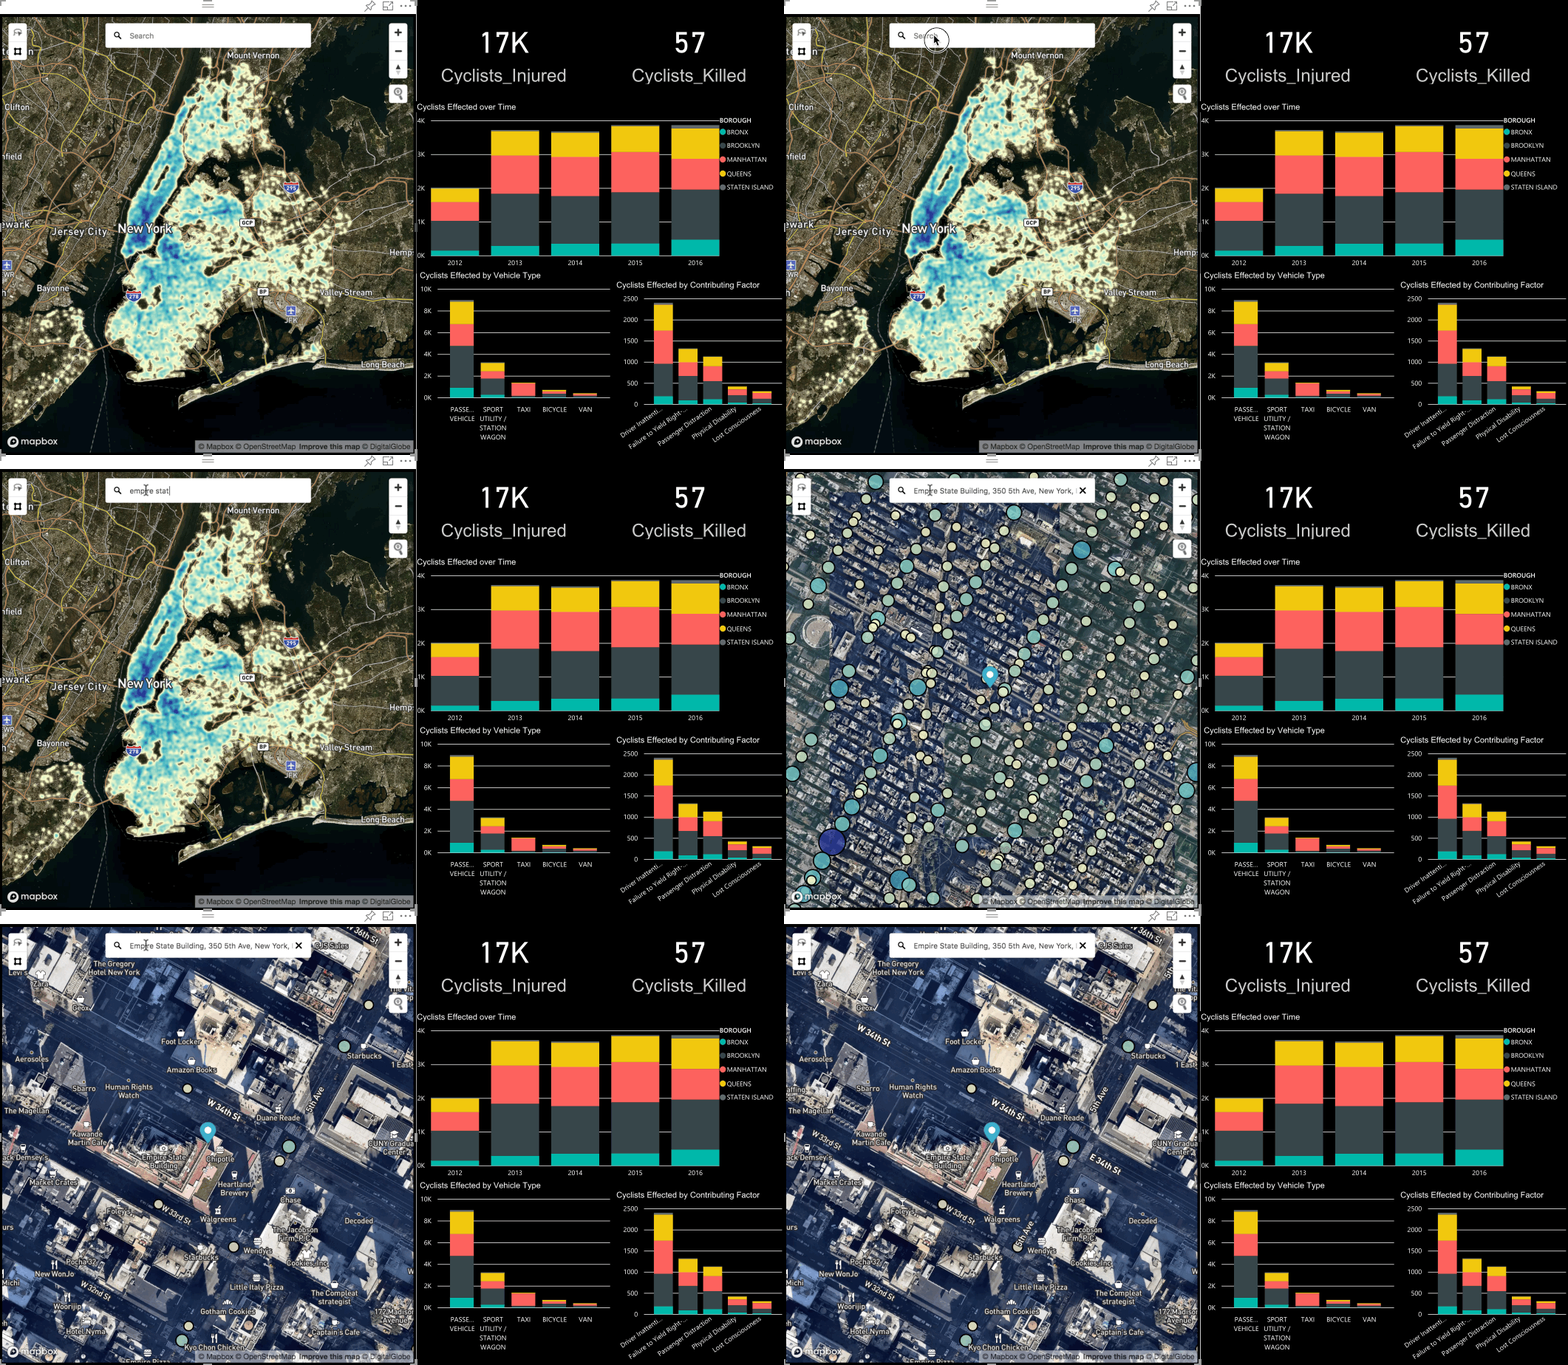
Add a search bar (geocoder) to the map
Use the search bar to quickly fly to any part of the map. Simply start typing a location and we will autofill suggested locations for you. Optionally drop a pin at the location.
Clik here to view.
Smarter tooltip formats, including disable tooltips
We’ve made our tooltips even smarter. Now the tooltip display format will match the underlying dimension’s format. If nothing is specified in the tooltip input, no tooltip will be shown.
Clik here to view.
Getting started
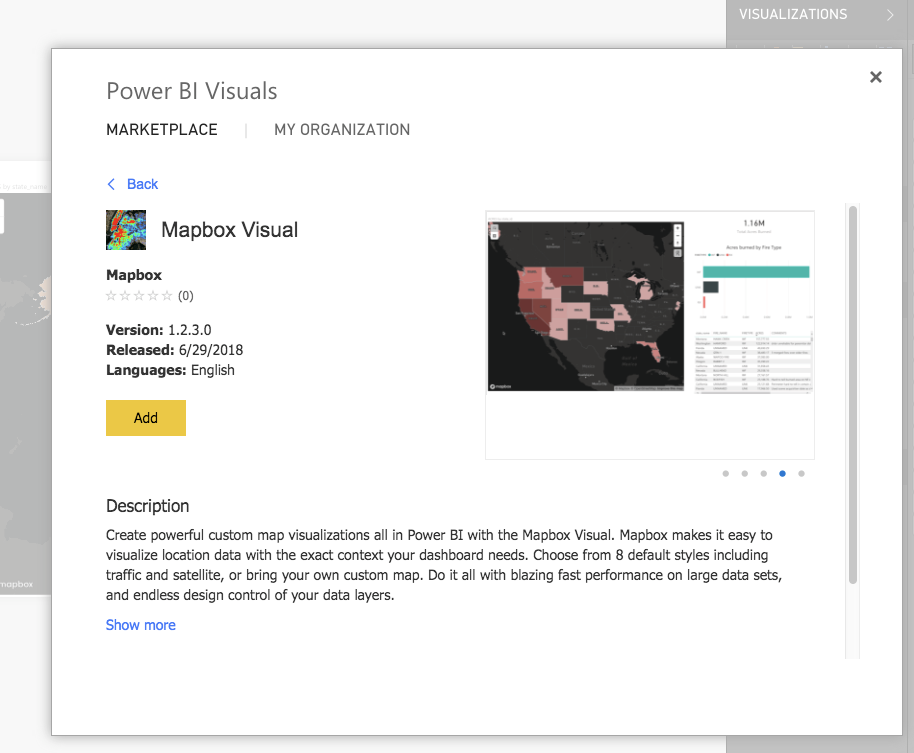
To start using the Mapbox Visual for Power BI, you’ll need to get a Mapbox account and a Power BI account. Then grab the Mapbox Visual for Power BI from the Microsoft Office Store.
Clik here to view.
If you’re interested in a more customized business intelligence solution, drop us a line.
Make something awesome that you want to share? Tag us on Twitter @mapbox or use the #builtwithmapbox hashtag.
Image may be NSFW.Clik here to view.

Six new features for Mapbox Visual for Power BI was originally published in Points of interest on Medium, where people are continuing the conversation by highlighting and responding to this story.