A unique perspective of UK healthcare data
By: Joe Gomez
Parallel specializes in mapping and data visualization with a focus on the UK healthcare sector. They use Studio and GL JS to render data-heavy map tiles, style basemaps and data overlays, and add interactivity to maps. Ashley Clough, founder of Parallel, shares some of their recent data explorations with our tools and why he uses our stack:
We love using Mapbox because of its open source ethos, incredible power, and particularly the relentless innovation: extruded 3D polygons — we love making city maps with those; heatmaps — whole new opportunities for massive datasets; GL terrain — an amazing, almost instant update for many of our existing styles. I lurk on Github and Mapbox.com waiting for the next bit of functionality to explore.
1. Heatmap with isochrones for 30,000+ schools across England and Wales
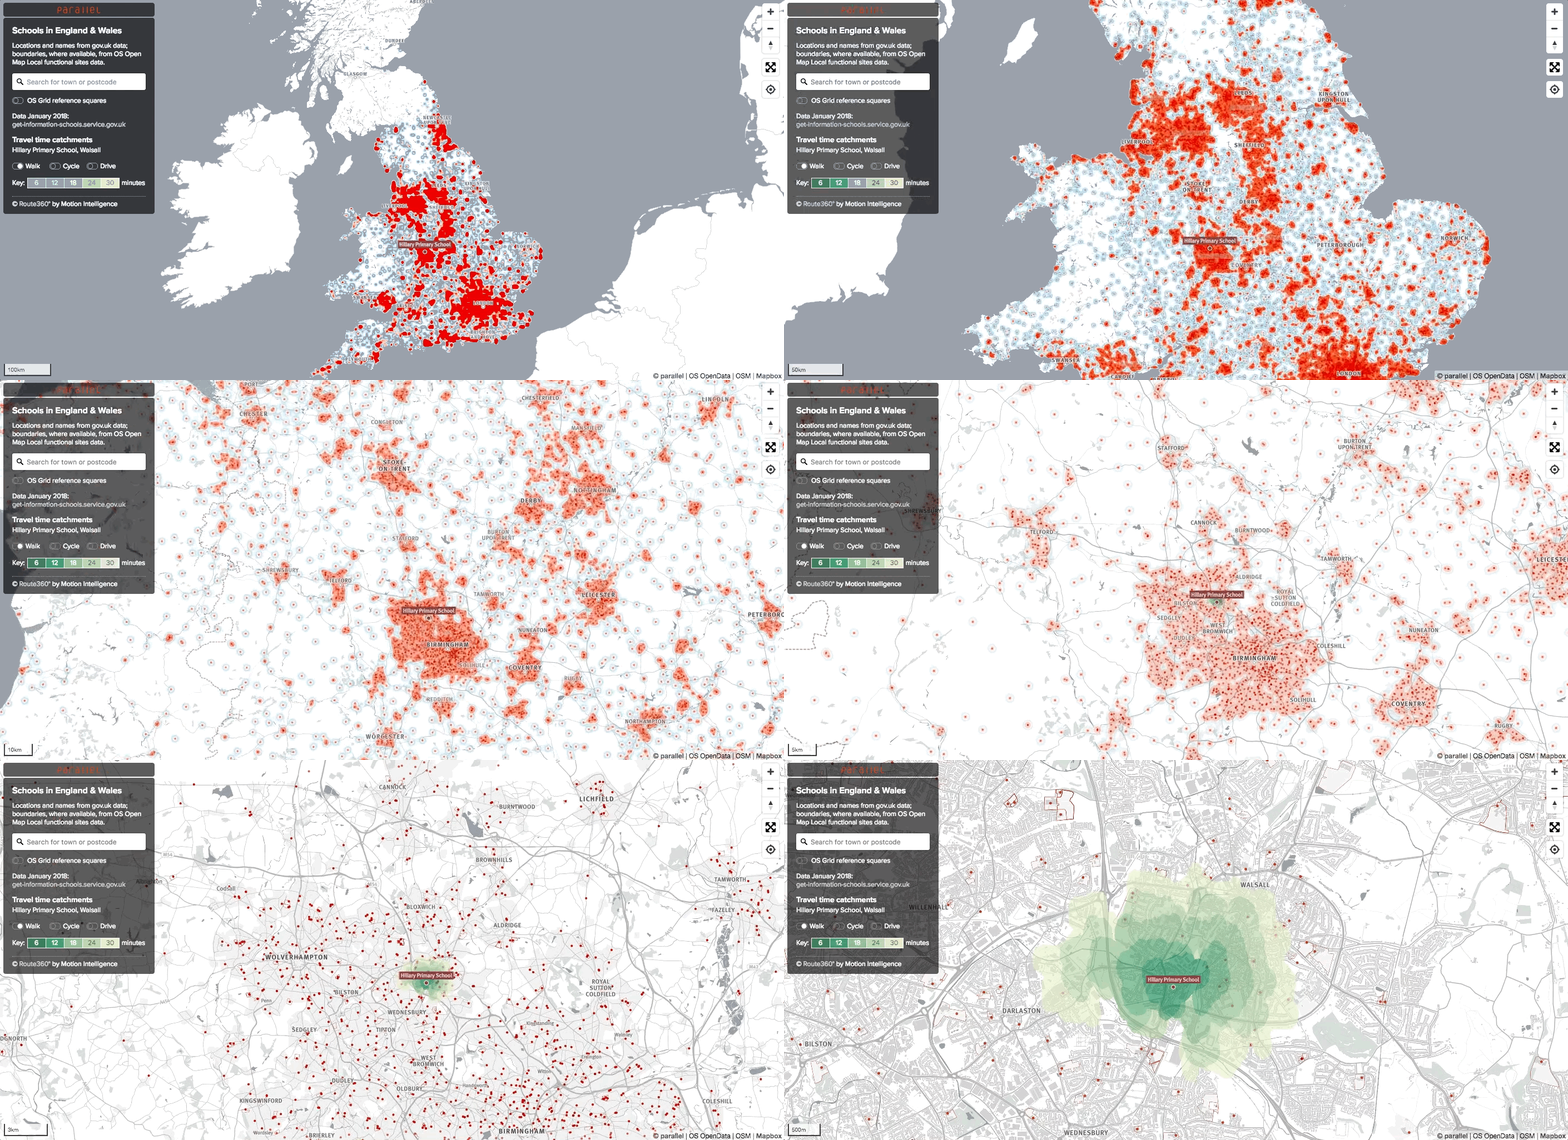
We were looking for an opportunity to use Mapbox GL heatmaps for a large point dataset (neatly processed using Tippecanoe) and link it to the dynamic isochrone generation tool we use. We wanted to give anyone the opportunity to create an isochrone around their local school and explore thousands of other schools.
2. Flood risk planning for City of Leeds
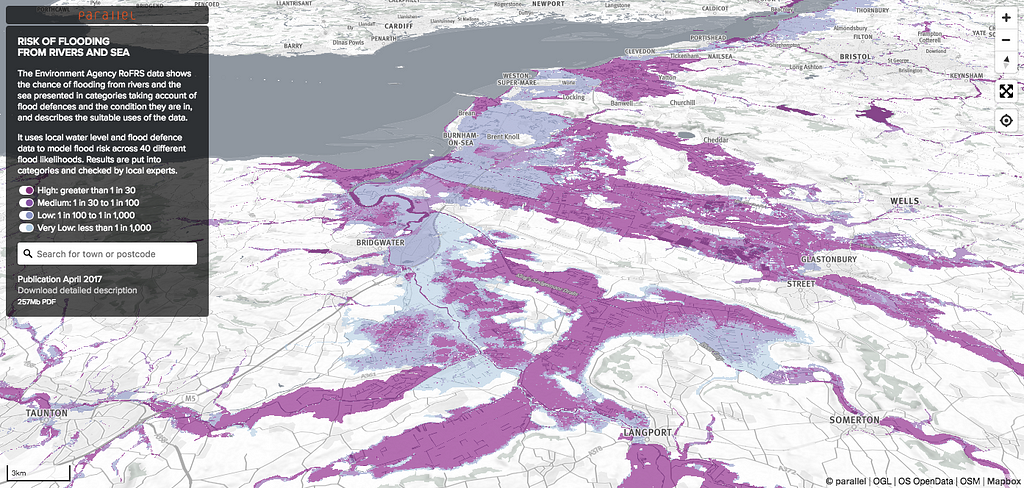
We’ve been processing the UK Environment Agency’s data for several years. The combination of interactive GL maps and the new dynamic, hillshade terrain rendering proved irresistible for presenting the latest variation of flood risk data on one of our OS Open Map Local basemaps.
3. London Atmospheric Emissions Inventory
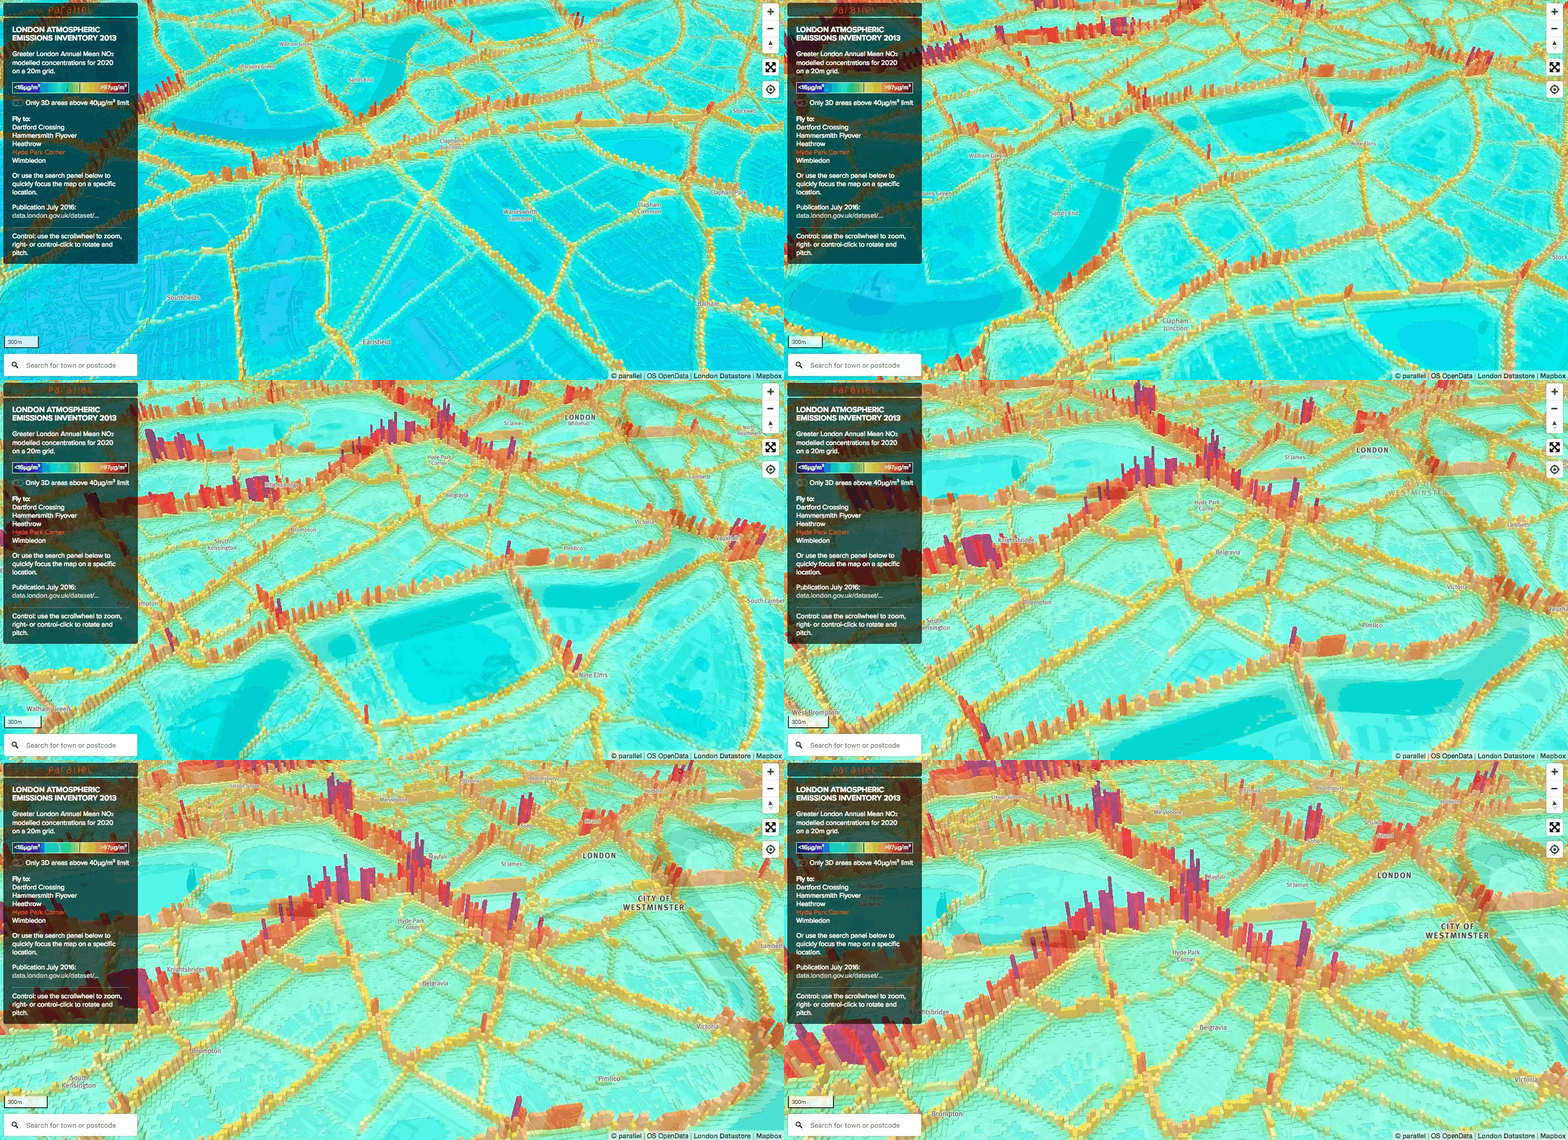
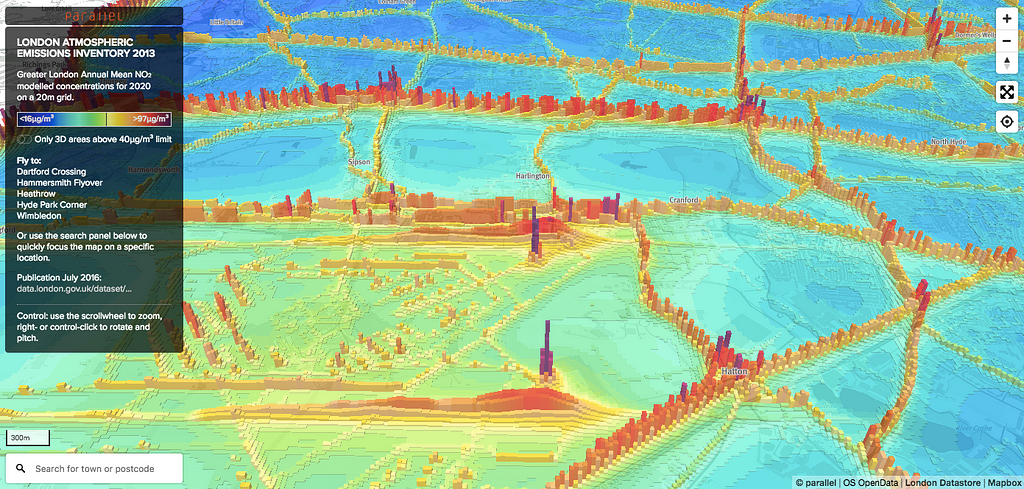
After we’d explored extruding 3D buildings in cities using LIDAR datasets, we thought it would be interesting to try rendering some virtual cities from other interesting datasets. The London air quality data in 2D doesn’t quite show the variation in concentrations across the city, but in 3D, using the extruded polygons in Mapbox GL, the ends of the runways at Heathrow stand out as literal high points.
4. Output area classifications for City of Leeds
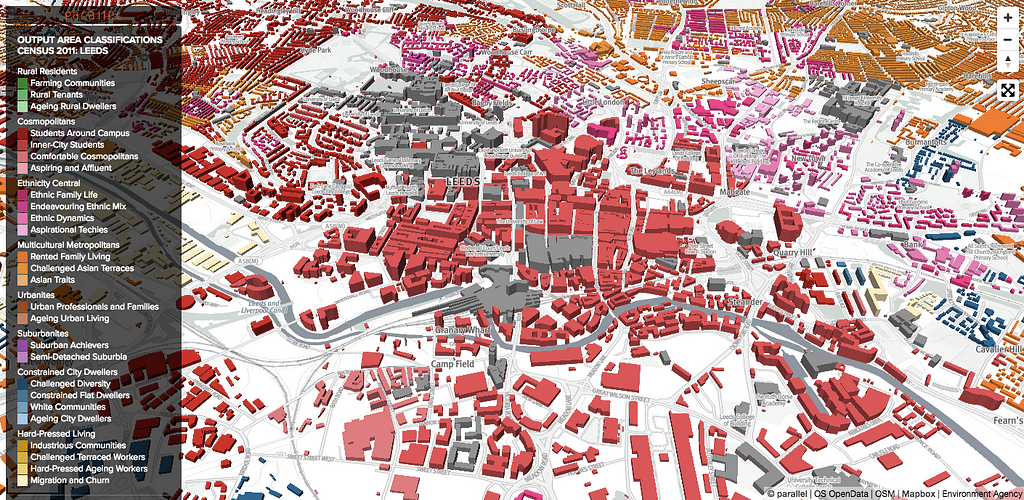
In our home city of Leeds, we’re constantly looking to map local open datasets. This combines national Census data with 3D building heights and locally-modeled building profiles (created in QGIS and stored in a PostGIS database). It allowed us to colour-code most of the city’s buildings and identify the types of people that live in the local areas.
5. Ward-level population projections for London
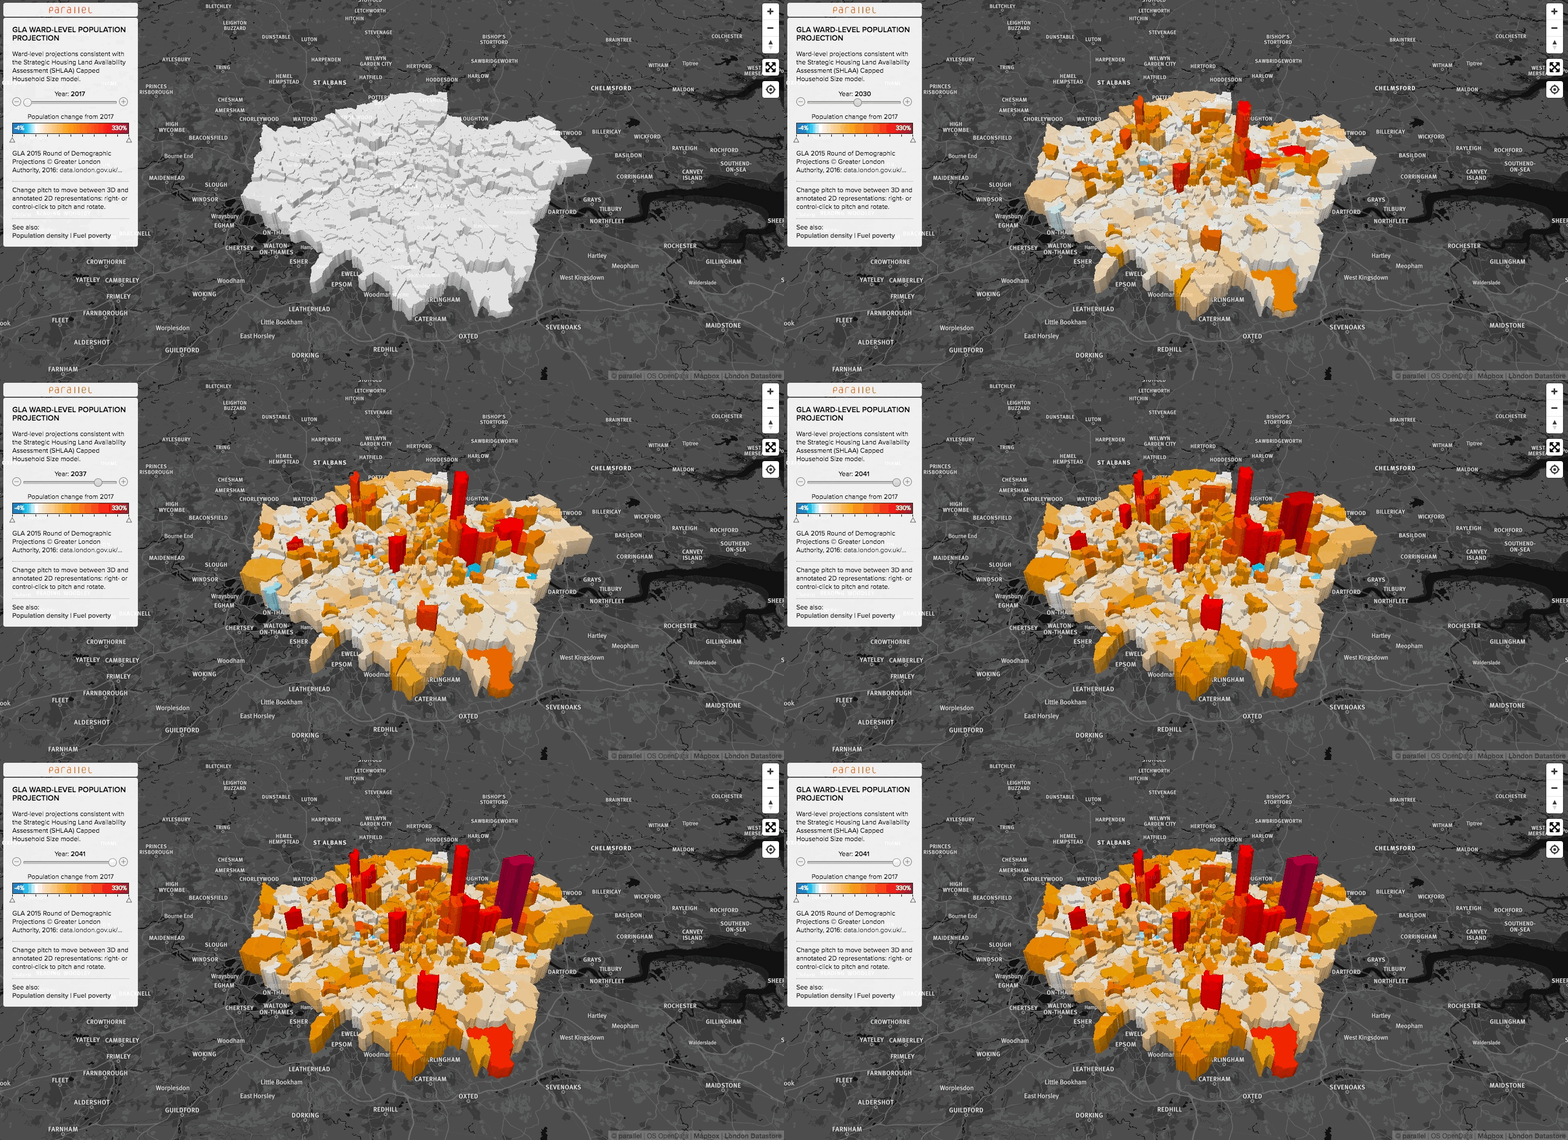
This is another 3D data rendering. With the time series population projection data for the wards in Greater London, we can let the user animate and filter the data over time. The data was processed by PostGIS, output as a tileset in Studio, and then rendered on-the-fly using Mapbox GL JS. Using the web API we can extrude and colour the ward areas based on both the population count and the percentage change from the base year.
Bonus: 1852 Map of York
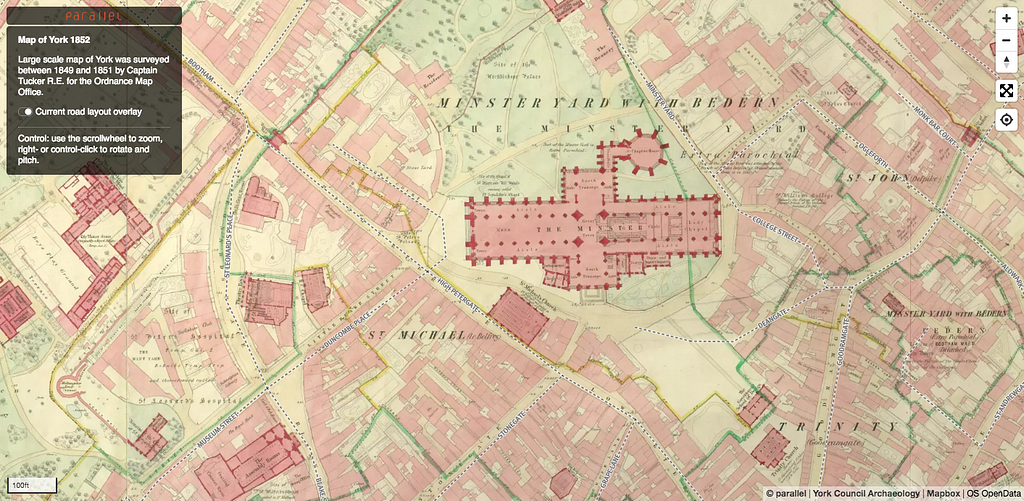
We persuaded the City of York Council to let us have copies of the 15 large, high-resolution scans of the original maps. These were then all stitched together in Photoshop creating an enormous 25k x 23k pixel image that was then georeferenced in QGIS and rasterised in Studio [like this tutorial]. It’s a hefty 3Gb tileset but worth it when you’re walking around the city and the map is updating its location on your mobile phone. Reading the map annotations is made easy by the infinite zooming and rotation capability of the GL API.
Check out more of Parallel’s mapping projects or learn more about our tools for BI and data viz. You can create an account and get started today with your own project in Studio.
5 data visualizations from Parallel was originally published in Points of interest on Medium, where people are continuing the conversation by highlighting and responding to this story.