By: Ryan Baumann
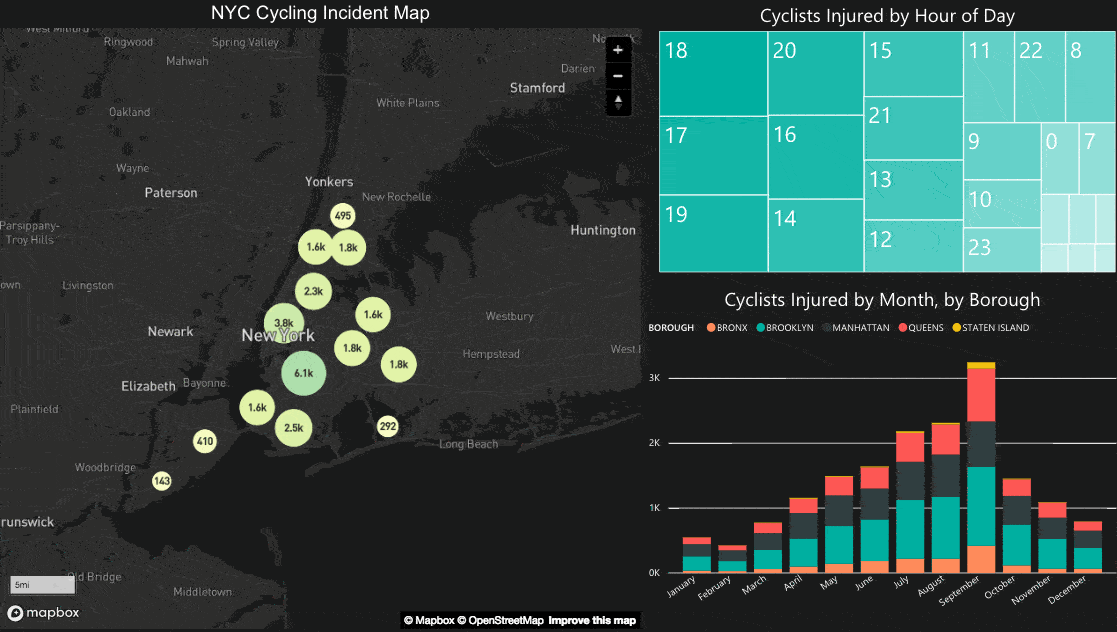
Today we’re launching the Mapbox Visual for Power BI, a plugin to use our visualization tools directly inside Microsoft Power BI. Drag and drop your data from Power BI into the Mapbox Visual to create fast, customizable maps. Bring in any of our eight map styles optimized for data visualization or drop in your own custom style with any geospatial data using Studio.
Here’s a rundown of the new plugin now available in Power BI:
Customizable visualizations
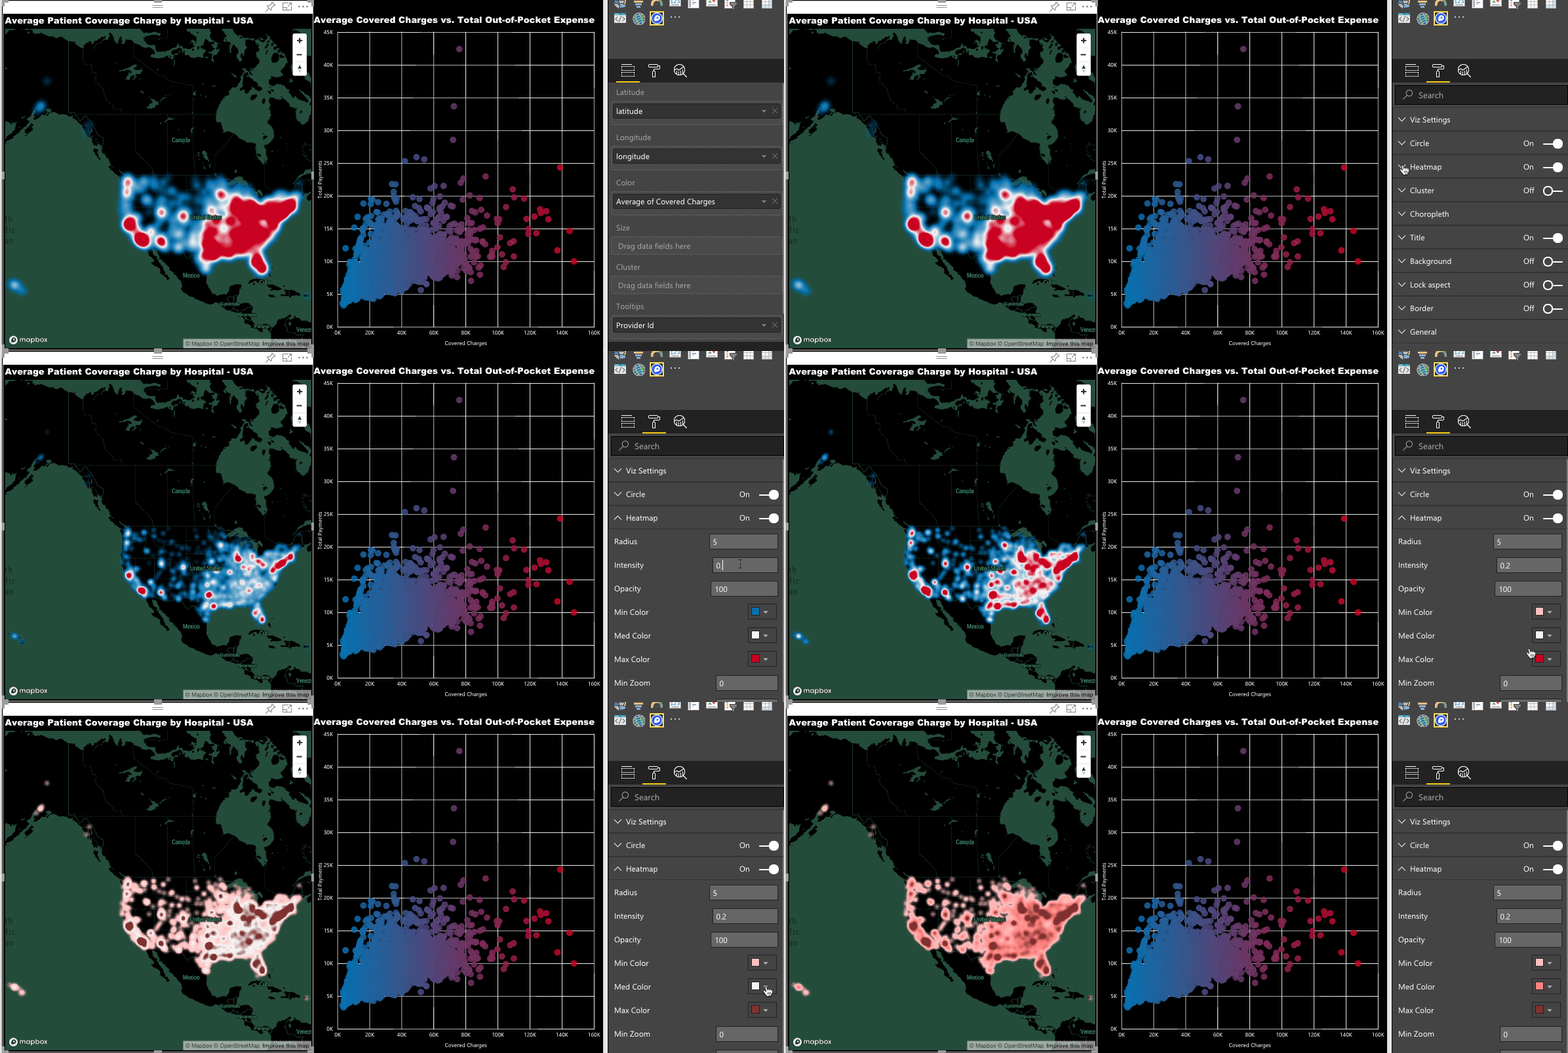
Use the plugin to explore your data as interactive heatmaps, graduated circles, or clusters. Add multiple data visualization layers to the same map and change visibility based on zoom.
Fast rendering
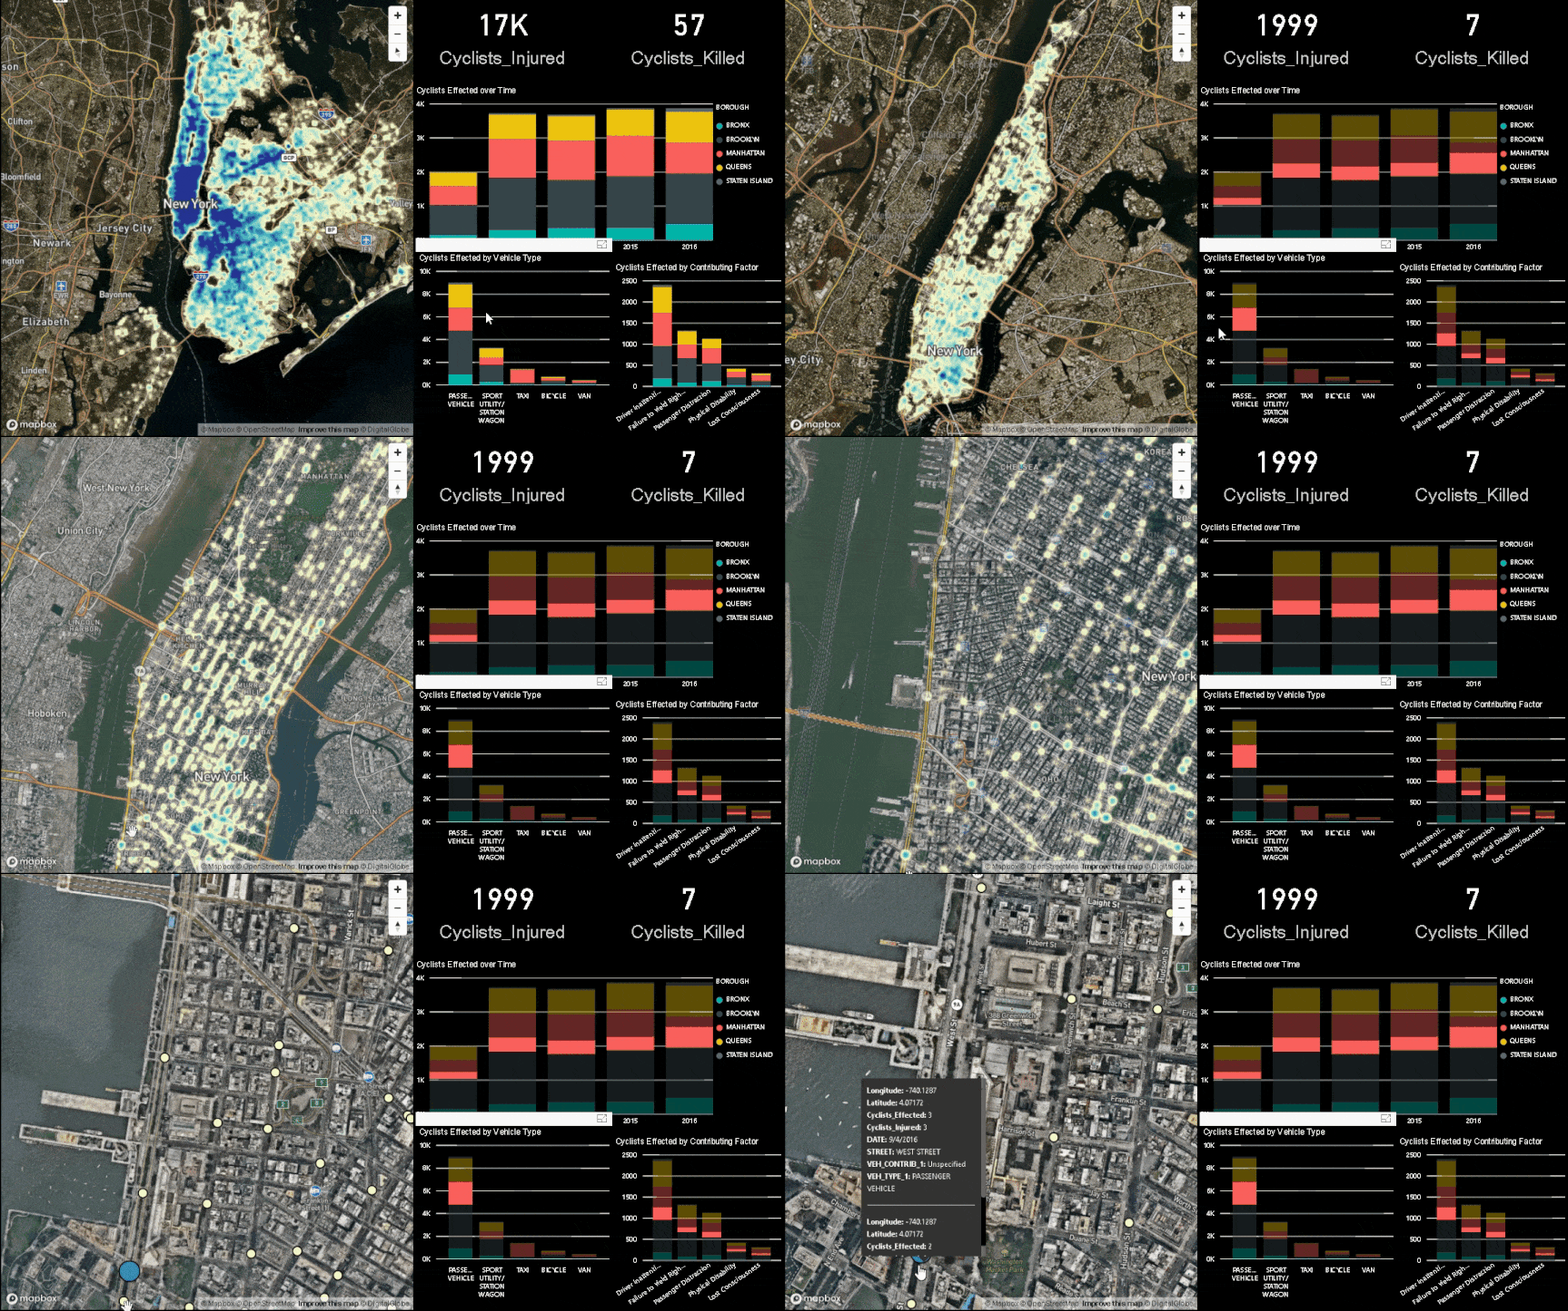
Filter and explore tens of thousands of data points with the fastest maps on the market, rendering vector tiles on the client at 60 frames-per-second (the speed of a video game).
Total design control
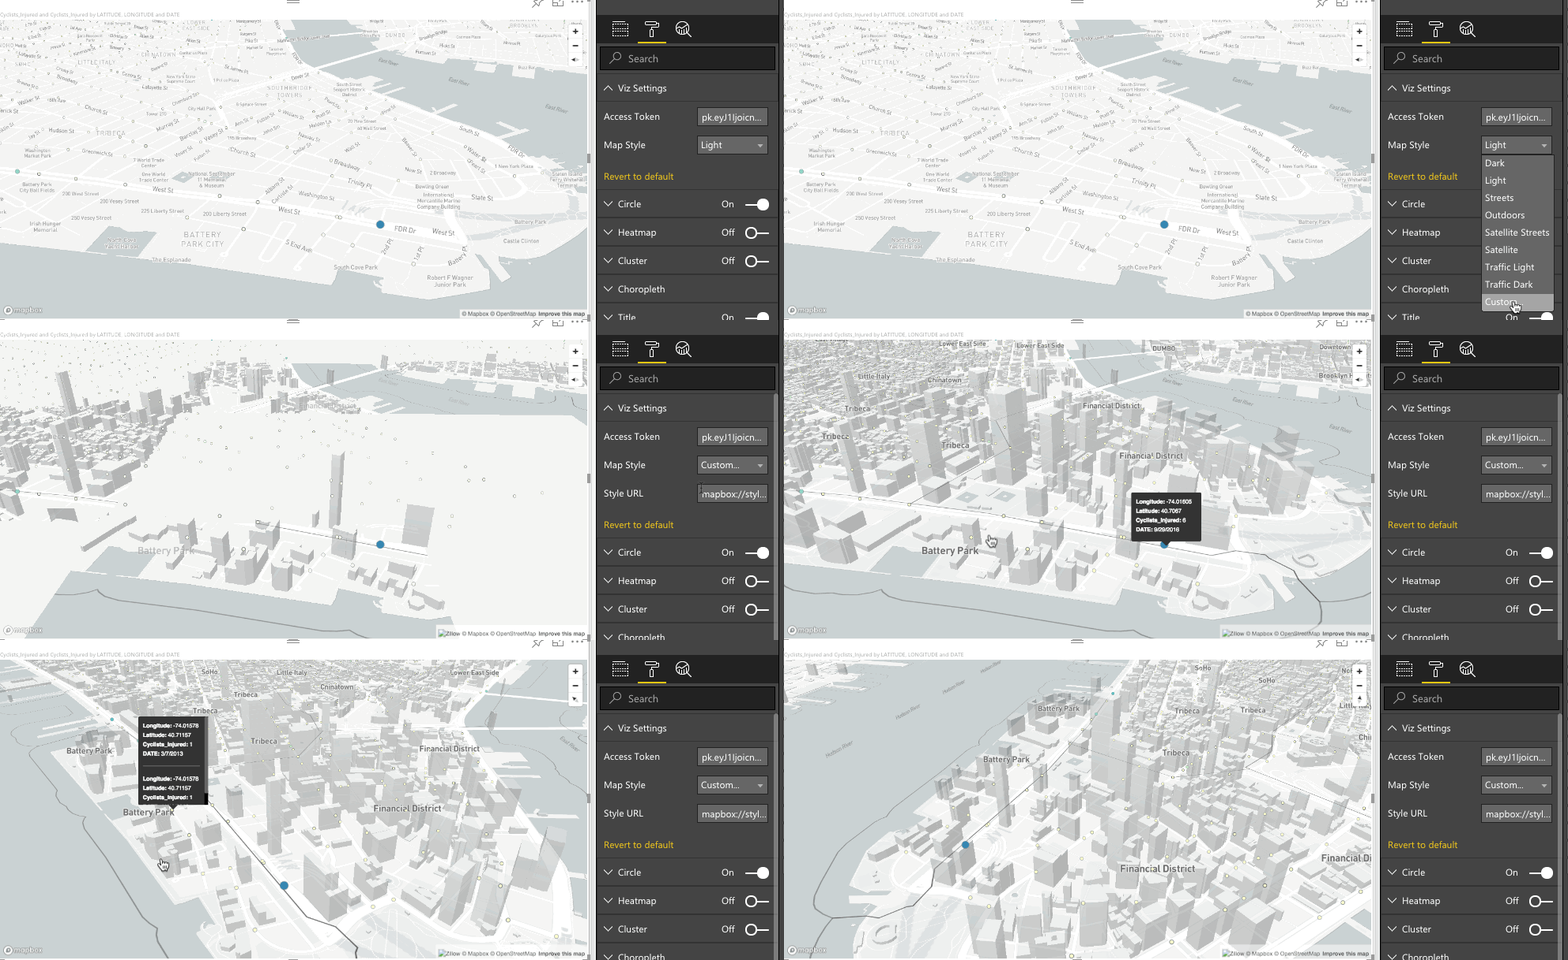
Add any of eight Mapbox map styles tailored for data visualization directly in Power BI, including high-resolution satellite, terrain, and traffic. Build a custom map style in Studio, and import it into your dashboard with one click.
Cluster by property value
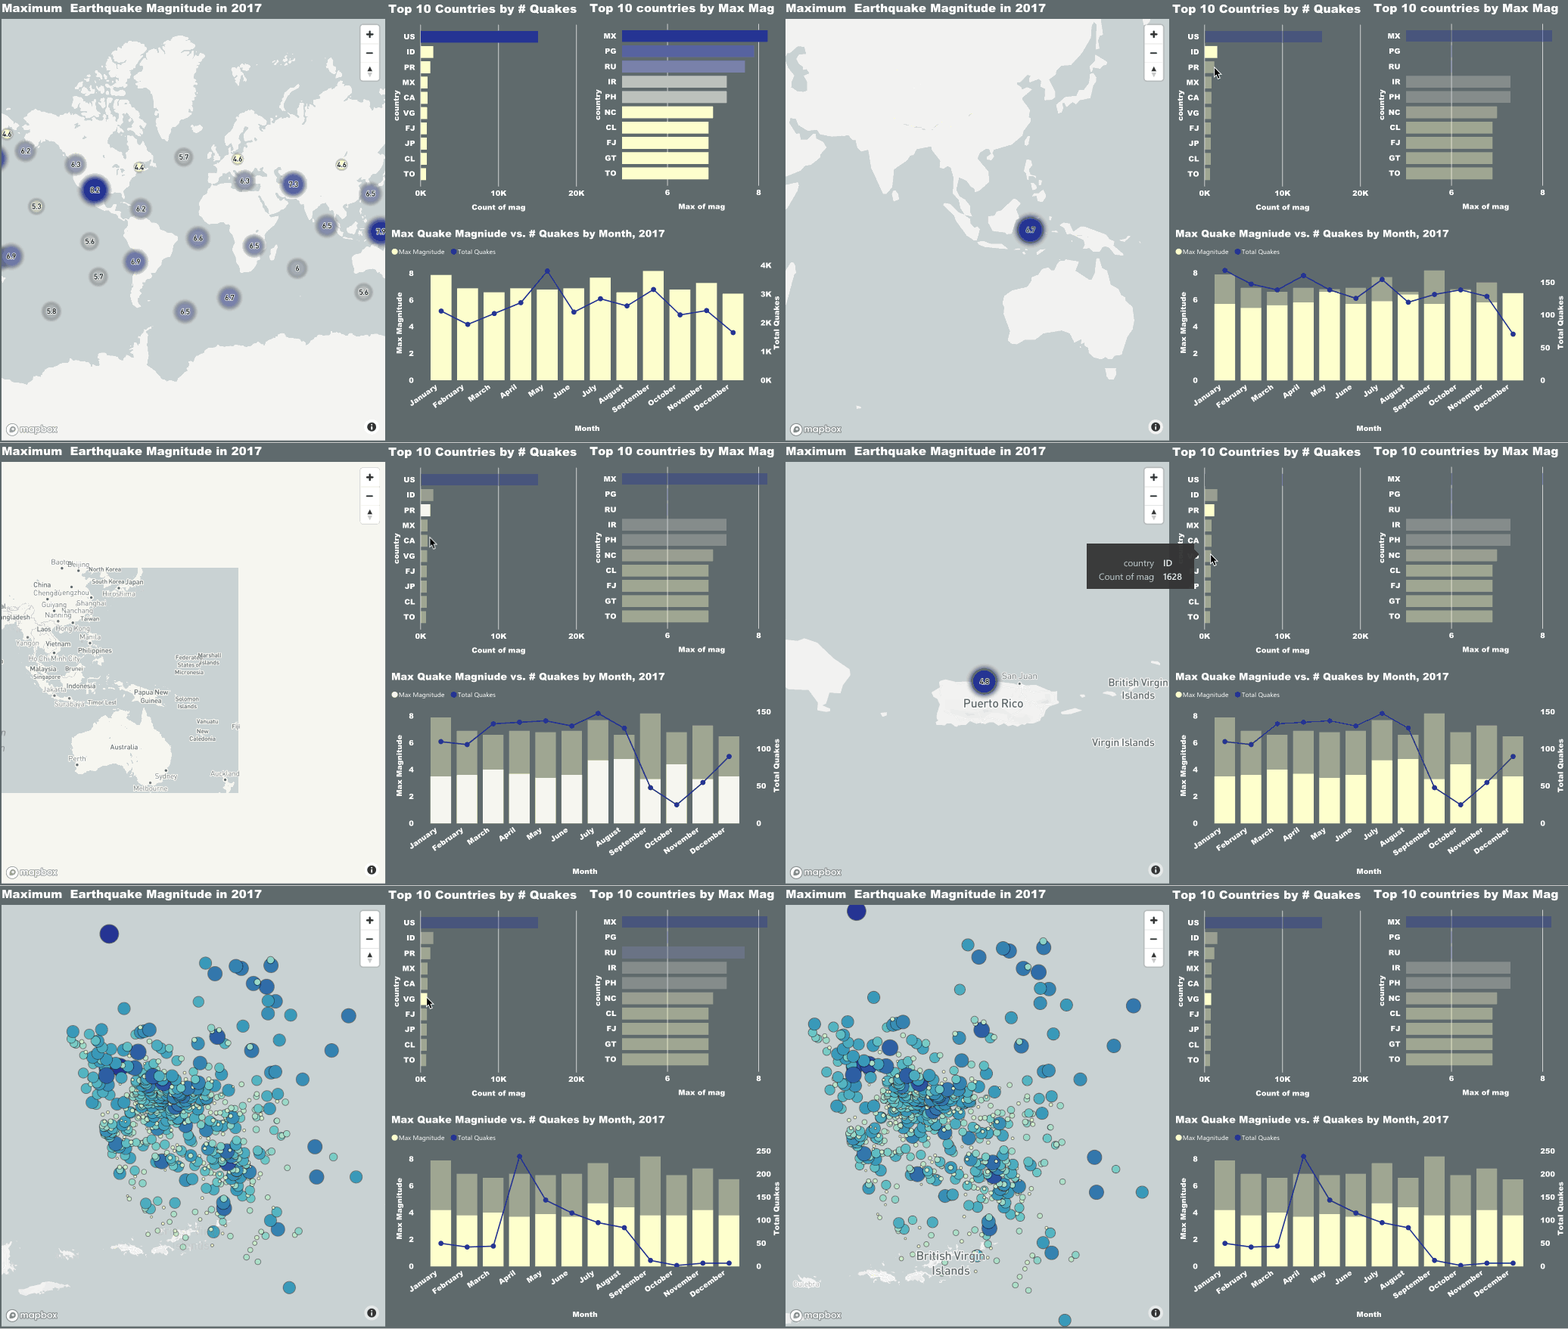
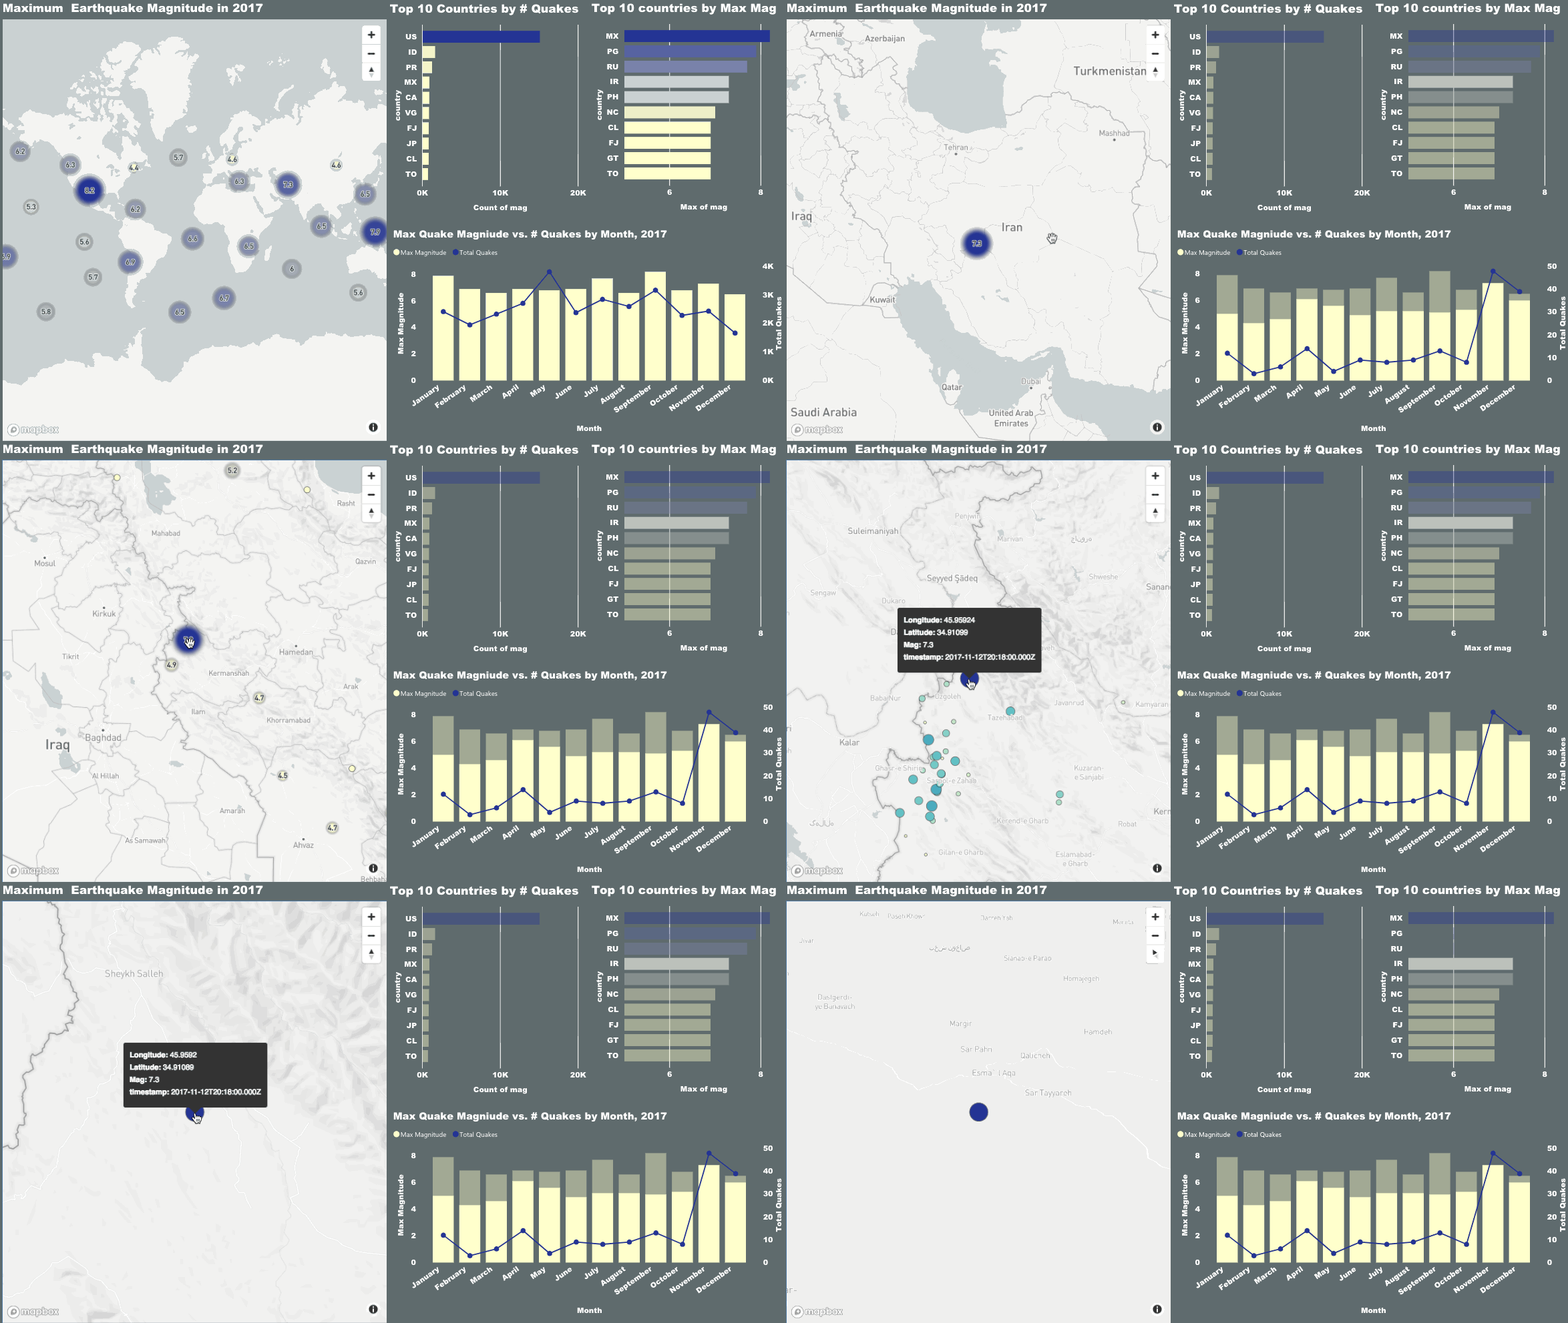
Understand data minimums/maximums, sums, and averages with property aggregation for clustering. For example, find the maximum earthquake magnitude by region and month in 2017, not just earthquake density.
Import custom data
Upload massive point, line, or polygon datasets in CSV, Shapefile, KML, GeoJSON, or GeoTIFF format. Add the data to your dashboard as a custom map style, such as a shapefile of neighborhood boundaries and names in New York City.
Getting started
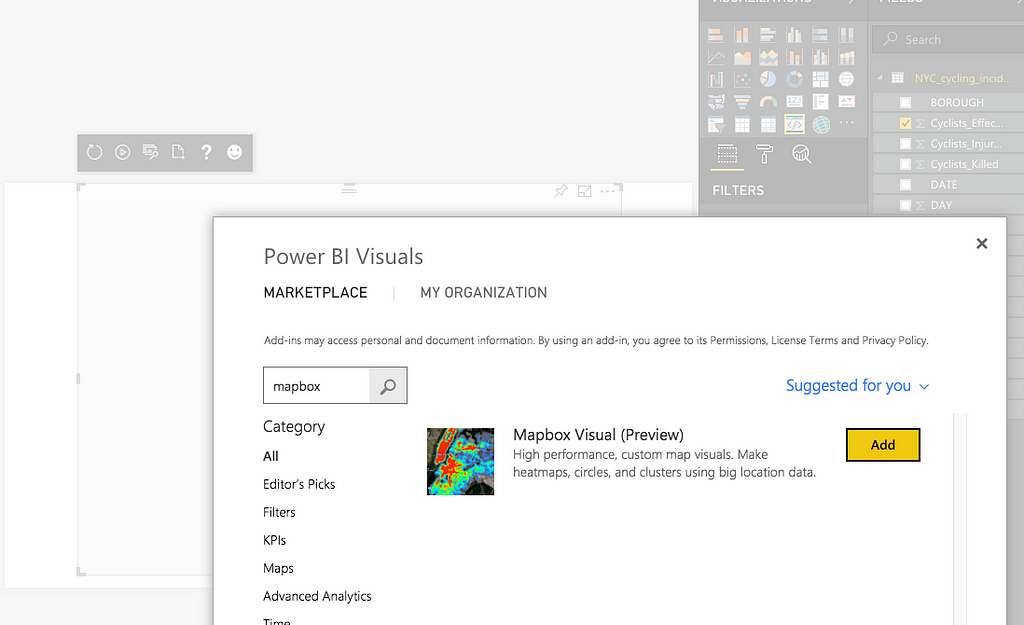
To use the Mapbox Visual for Power BI, you’ll need a Mapbox account and a Power BI Desktop account. Grab the Mapbox Visual for Power BI from the Microsoft Office Store or directly from your Power BI dashboard. Just click add from marketplace and search Mapbox.
For full step-by-step instructions, including getting started with the plugin, check out this tutorial.
Are you a business intelligence developer? The Mapbox Visual for Power BI is open-source on GitHub. Pull requests and issue tickets for bugs and features are welcome.
What’s next?
Send us a tweet @Mapbox to show us what you build. If you want to extend the visual in a custom Power BI implementation, drop us a line or add a feature request on the project’s open-source GitHub repository.
The fastest maps in Microsoft Power BI was originally published in Points of interest on Medium, where people are continuing the conversation by highlighting and responding to this story.