Land cover and land use map classifications from satellite imagery can be pulled into the Maps SDK for Unity. With a clear view of the ground and the 11-band spectrum from NASA satellites, we’re able to identify unique land cover classes ranging from slight vegetation changes to more dramatic differences between the built and natural environments. Letting you, for example, design a detailed Minecraft-inspired world in Unity.
In addition to the analysis of land classification from satellite imagery, we combine multiple data sources around the world so we can have higher-resolution in places where it’s available. Currently, we have processed:
USGS, 30m resolution, USA including Alaska, Hawaii, and Puerto Rico
GeoBase (combined Canadian gov’t sources), 30m resolution
European Environment Agency, 100m resolution
Geoscience Australia, 300m resolution
NASA MODIS, 500m resolution globally
We’ve merged dozens of different classifications ranging from different classification systems for each source down to agriculture, cemetery, glacier, grass, hospital, industrial, park, parking, piste, pitch, rock, sand, school, scrub, wood, aboriginal_lands, national_park, wetland, wetland_noveg.
Landcover data is streamed in a scale-appropriate manner, meaning the landcover map is tiled in small pieces and distributed with low latency around the globe. You can explore the data in detail in Studio:
Graphicacy helps mission-driven organizations make data more visual, persuasive, and shareable. Recently, they worked with the Center for American Progress to map childcare deserts across the country. They defined childcare deserts as census tracts where there are more than three times as many children as licensed child care providers.
Our assumption is that power users and policy experts are going to stay on the page longer if we make exploring the data more engaging and interactive. -Eduardo Velez, Senior Front-end developer
Graphicacy used Studio and GL JS, our web API, to design the map and create an interactive experience. Users can “fly to” a state and explore the distribution of health care centers, as well as census tracts styled to represent “desert” and “non-desert” locations. A pop-up menu updates as you hover over the map features.
The feature support and documentation for GL JS made it an easy choice for adding interactivity. Mapbox Studio gave our designers full creative control so we could try different colors, adjust the presentation of layers, style labels, etc. all without relying on a developer. -William Merrow, Data Analyst & Visualization Specialist
Graphicacy also developed a data tool in partnership with the Public Policy Institute of California. It links a map with interactive charts so policymakers can explore how changes to housing costs, minimum wage, and the social safety net could affect child poverty statewide and at the county level.
One early design decision was to present a map and bar chart together, displaying the same information. Choropleth maps are good at showing geographic patterns, but bar charts and line charts are better at communicating the actual data values and the distribution of a dataset.We needed to create an interaction between the map and bar chart to help the user understand that the two are connected. -William Merrow, Data Analyst & Visualization Specialist
The visualization was built as an Angular/RxJS app, incorporating D3.js and GL JS so the map is reactive to user interactions with the bar chart.
I’m working on feature collections, based on KdTree using building positions, which will enable high-performance feature querying with the Maps SDK for Unity. In the video below, there are 12,401 buildings, and I’m querying for all buildings in brush range on every frame. This isn’t a shader or post process effect, it really is searching and finding buildings and then changing their material colors individually.
This is powerful for use cases like rendering only the features in a certain range, finding the closest features to a player (i.e. restaurants or buildings taller than a threshold), or changing properties of features depending on their distance to a point (similar to this painting example).
Today, the FCC launched a new National Broadband Map, allowing Americans to inspect broadband provider availability in every county, city, and even neighborhood across the U.S.
For this map, the FCC needed to display a massive amount of data on broadband availability and broadband speeds across the US, down to the neighborhood level. It needed to be interactive, so that Americans can understand what broadband coverage is available to them, and where there are still areas of no broadband options that the FCC needs to address.
As Commissioner Roscenworcel said after seeing the map at the February FCC Open Meeting,
“To have a fair shot at success, you need access to broadband […] So today we start with a map. This is important because the old adage is true, you cannot manage problems that you do not measure. With this tool, we can identify where service is and is not, where facilities are being built and where they are lacking. And how communities are connected and how they are at risk of falling behind. In other words, we have a blueprint for action that will provide everyone from consumers to policymakers with more information.”
The map displays an FCC dataset with over 68 million records, across 11 million blocks, with 441 different broadband providers — this makes for nearly 5 billion vector combinations. Once a user adds in their address, they can see the broadband providers available for their home along with provider tech and speeds. Users can interact with the map at all levels, starting from visualizing coverage in their neighborhood or block and drilling all the way up to nationwide view.
With our tools, the FCC can embed this 5 billion vector combination dataset into a map offering high rendering performance at every zoom level. The Tippecanoe vector tile generation tool subdivides the data spatially, merges blocks that have the same broadband networks available, and makes other geometric simplifications to represent the data as compactly as possible. In the user’s web browser, GL JS dynamically scales and styles this tiled data, ensuring seamless interaction with the map.
If you’re a developer needing to visualize enormous data, or even 5 billion-combination datasets, Mapbox’s data visualization tools can help you bin and render this data at scale. Contact us for help, or check out our guides to get started with Tippecanoe and adding map interactivity with GL JS.
With the new 32bit vertex indexing in Unity 2017.3, it’s now possible to fit all buildings in the San Francisco peninsula into one GameObject using the Maps SDK for Unity. We already had MergeModifierStack class which merged buildings into one GameObject up to 65k vertices. 32bit vertex indexing removed that hard limit so with some changes, I was able to merge all buildings in all tiles into one object.
Here is what a few hundred thousand buildings with~9,784,100 vertices look like: (Protip: Don’t forget to set Mesh.indexFormat = IndexFormat.UInt32)
Our maps and location services are now integrated into Bright Box’s Remoto connected-car platform, enabling enterprises and their customers to track a car’s location and performance in real-time. Remoto’s full stack of AI-enabled tech aggregates telematics data and supports a connected feedback loop for OEMs, dealers, end consumers, and other industry players.
OEMs use Remoto to gain insights into user behavior, dealers access predictive analytics and CRM services, insurance companies can monitor driving behavior, and consumers can interact with vehicle data through mobile apps and dashboards. Chief Product Officer Vitaly Baum explains how it’s all hinged on location.
What are some of the things you’re doing with maps and location data?
We have a list of services that use the car’s location for tracking trips and vehicle data, showing routes on the map, and geofencing. One feature that is quite popular is valet-parking control. When the valet picks up the car, the user can track its location. If the car goes further than 0.3 miles, the user receives a push notification. You can set a geofenced area on the map and track the exit/entrance into the zone. You can also track speeding and vehicle events like “bumps” and towing. This comes in handy when lending the car to friends and family.
Why did you choose our platform for building location services into Remoto?
The ability to customize the presentation of the map and map data for style and branding was critical for us. We’re also really excited that the maps are constantly being improved by the anonymized telemetry data that’s collected through the mobile SDKs — the quality of the maps and coverage around the world is very important. Mapbox also has a great ecosystem of services, such as map matching, geocoding, and navigation.
Can you tell us about how you’re using some of those services?
We use the Maps SDK for Android and iOS platforms to display maps inside our mobile applications. With the Map Matching API, we can beautifully display the user’s trips if there’s a lot of noise pollution from our GNSS sensors. Then we use the Geocoding API to show the addresses of current vehicle locations. This is also used for sharing the location of the vehicle in the case of roadside assistance. We easily migrated from another data provider without any problems so we’re really satisfied with the services.
Any Mapbox features you plan to add or explore in the near future?
The millimeter precision HD Vector Maps are an effective tool for us as we expand in the smart insurance space. We see huge potential in high-frequency maps because this can help recreate the conditions of any road incident. It provides a good input for understanding people’s driving style. We also have plans to integrate parking services for our end users so very accurate, detailed maps are necessary to identify parking locations.
How about in the longterm, what kind of innovation can we expect from Remoto in terms of location?
Last year, we launched an AI-enabled system for OEMs and dealerships — Remoto AI. It’s based on processing 90 terabytes of data from connected car users around the world, and it can evaluate a customer’s lifestyle and recommend accessories, sell cars based on driving style and individual preferences/habits. We’re offering drivers from different categories a tailored set of products and services based on analyses of vehicle telemetry, social networks, and master data. The location of the vehicle is the most important part of this scoring. Based on this data, we’ll be able to provide targeted products to the whole market.
A sneak peek of new HD imagery from DigitalGlobe shows off the five arenas of the 2018 Pyeongchang Winter Olympics. Using our imagery processing pipeline, we were able to process all 50 GB (or 298 km2) of HD Imagery in 25 minutes.
Pyeonchang Olympic StadiumEntrance to Pyeonchang Stadium at zoom level 18
This is a sneak peek of DigitalGlobe’s new HD Imagery, which processes high resolution imagery in a way that dramatically improves the usefulness of the image and enables users to extract every bit of detail physically possible of the imagery collected by their satellite constellation.
Look at zoom level 18; you’re even able to see the Olympic signage on the ski jump!
Left: Alpensia Ski Jumping Centre | Right: Alpensia Ski Jumping Centre at z18Left: Alpensia Biatholon Centre | Right: Alpensia Sliding Centre
Have thoughts for DigitalGlobe or for us on how you could use this level of detail? Tweet us @mapbox or @digitalglobe to let us know.
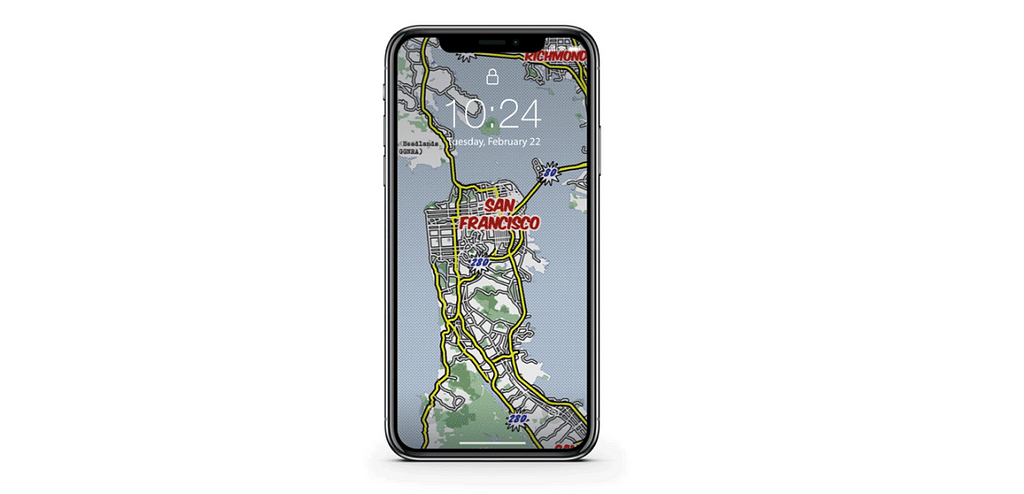
Show off your custom map design, share a view of your favorite spots from our satellite map, or anything else you can imagine. Get started with these three steps:
1.) Chose your map style Sign into your Studio account and select a map you’ve already created, or add any from our designer map series.
2.) Pick your city, town, or country Once you’ve chosen your location, follow the prompts in our Static API playground and create your image.
3.) Add to your iPhone wallpaper Save the image the Static API playground produced and add it to your phone.
I love having a wallpaper on my iPhone that no one else has. I used to do Google image searches, but that was never personal or sized correctly. With this new feature, I made a unique wallpaper that looks great on my phone screen.
Ratios and resolutions
The key to making perfect wallpaper maps is sizing the image — in this case the map. Here’s a quick reference guide to get you started:
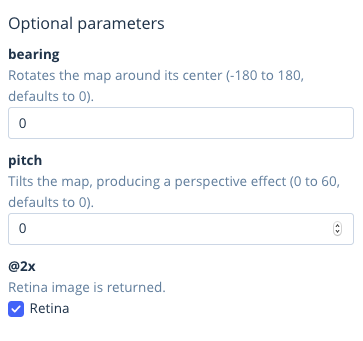
For all phones, use the pixel sizes aboveand select @2x Retinaimage to have the perfect size and resolution for your phone.
Go create a perfectly sized iPhone wallpaper of your custom designed maps now and share your screen with us on Twitter @Mapbox. Want to know more about creating the maps sized for mobile? Take a look at these two guides from Nat and Amy Lee.
Barry Sowerwine is joining as VP of Global Sales! When you first meet Barry, you instantly feel his energy for selling mission-oriented products. Ensuring our developers and customers are our number one focus has not only proven to be the right way to build a financially strong company at Mapbox, it’s also exactly what Barry did at Tableau. With this idea in mind, he grew the business from $7M in bookings in 2010 to over $325M by 2016 as SVP of Americas Enterprise Sales.
What we most value is Barry’s focus on customer empathy and maximizing human potential and relationships. It was this same passion and energy I see day in and day out at Mapbox from our founding team — and it’s that relentless energy and enthusiasm combined with detailed-oriented discipline we look for in a sales leader to take us to a new level of scale.
We work this hard building our product so that everyone in the world will benefit from our location stack, and our sales team is that direct relationship with developers, builders, and product leaders to make sure that happens. They support our customers by giving them the right building blocks to create exactly what they need. Part of sales is aligning dollars to our products, but that only happens after the customer realizes the impact of our product and understands how powerful our SDKs and APIs are. It’s this obsession with both our product and taking care of customers that is our foundation, and it’s that product understanding that not only sells our product, but also helps our product and engineering teams understand what the world needs. This opportunity is best said by Barry himself:
“Everything about Mapbox felt different, refreshing for sure, but very different. There was a beautiful simplicity in how everyone talked about the mission of the company. Location data is critically important today, but in the future, it will be integrated into our daily lives in ways we are only now beginning to imagine. With a product and people first mentality, I believe Mapbox is uniquely positioned to help organizations leverage location data in a way that’s specific to their business, use case and desired user experience. Simply put, Mapbox provides the only location data platform that can be leveraged “your way”. With Mapbox, you’re enabled, not controlled. I am very excited to be joining such an amazing company.”
“Mr. Passion” as Barry was known at Tableau, was all about living up to the higher purpose of the company. He was equally a builder and coach, and his teams all looked up to him. People follow him, he’s a natural leader with a zen leadership style, and became one of the “spiritual leaders” at Tableau. He builds chemistry with intelligent people, not just dollar motivated people. It’s this kind of leadership style that we expect across our entire team.
Modern journalists have a very versatile skill set. From coding to data wrangling, these talents are not just applicable to journalism. They can make tech better. That’s why journalists can and should work across industries to tell impactful stories. Lo Bénichou and Casey Miller have made the move over from WIRED and Vox to work at Mapbox and have created their own team called the Narratives Desk. There, they tell stories and build data viz using Mapbox tools. In this talk, we will show you why journalists should branch out and work in non-journalism jobs. We are needed everywhere. Especially now.
We’re hiring for over 60 open positions in San Francisco, Washington DC, and our satellite offices around the world. Check out our values, and if you want to learn more about life at Mapbox, we’ll have folks tabling at the career fair from Search, Platform, and Design teams as well as Customer Success, Growth, and Product Marketing.
Here are a few roles Brie and Beatrice will be running 15-minute lightning interviews for:
You can read more about how we hire empathetic and passionate people and how we approach teaching and learning new things. Here’s a glimpse of our culture and some of the projects we’re working on:
Lesbians Who Tech 2018 was originally published in Points of interest on Medium, where people are continuing the conversation by highlighting and responding to this story.
Satellite imagery in the Maps SDK for Unity streams as JPEGs with optimized compression settings. Developers can specify the level of image compression manually or gauge bandwidth by testing the download speed of a sample tile and adjusting compression automatically.
Here’s a breakdown of tile sizes by compression level:
I’ve been using two options for polygon UV mapping, the 3D texture modeling process when we project a 2D image to a 3D surface. The first method is a “tiled” UV map, and the second is a “satellite/stretched” UV map. Now we’re experimenting with a third option called “atlas texturing”.
Tiled UV mapping
Tiled UV mapping simply assigns the X & Z value of the vertex position as UV coordinates. This guarantees that the textures are repeated for each tile seamlessly so if you create multiple tiles with large land use polygons and assign grass texture on them using tiled UV mapping, you’ll have seamless tiling even at tile edges.
Each small square you see on the building rooftops is actually the whole texture on the material, and of course, this repeating can be tweaked by the Tiling property under the material.
Satellite/stretched UV mapping
The second UV mapping option is Satellite/stretched. This UV mapping process assumes one corner (of the tile) is (0,0), and the opposite corner is (1,1). It sets all UV coordinates relative to those two positions. So for example, a point right in the middle of the tile will get (0.5, 0.5) UV coordinates. This is, at the moment, mainly used for applying satellite imagery on vector features, hence my naming it “Satellite”.
This is actually all just one tile, and you can clearly see the whole texture applied to all features. If the texture was satellite imagery, for example, there would be satellite building rooftops on those polygons.
Textures used for reference.
Atlas UV mapping
I’ve started experimenting with what I’m calling “Atlas” UV mapping and planning to release the initial test version next week. You will be able to now choose the Atlas option under the UV modifier within the Maps SDK for Unity.
This loads an AtlasInfo object, a new scriptable object where you can define which segments are usable for polygons (or rooftops).
For simplicity, I’ve defined two test segments at bottom right as roof textures. The system then randomly chooses one of these segments and applies it to each individual polygon (the building rooftop in this case). It’s traditionally not easy to UV map procedurally generated polygons so I’ve been working on some simplifications. In my initial tests, I made the assumption that the majority of polygons are rectangles since it’s much easier to apply a square texture on a rectangular polygon. If the assumption is correct and the vast majority of buildings in the city are rectangular, all others will just blend in and get lost among others. What we did for this first test is:
Find the main axis of the rectangle by subtracting the first vertex from the last (so last edge will be the X-axis).
Find the axis aligned bounding box (aabb) using this axis. Now it’s rotated and contains all vertices of the polygon so it won’t be aligned to world X/Y.
Apply texture on this aabb, using minimum vertex (not first!) as (0,0) and max as (1,1).
Here you can see lots of rectangular buildings and their UV mapping clearly. I know this doesn’t look pretty with those UV textures, but it’ll look much better with proper textures.
However, there are some cases where Atlas UV mapping doesn’t work well:
Circular buildings (rare but you will run into this in each city)
Extremely tall or wide polygons (texture stretches too much)
Complex shapes and U or W shaped buildings (you can see a few of them in the above shot)
Download the Maps SDK for Unity and give Atlas UV mapping a try or read more about what’s possible with maps and location data in Unity.
Federico Bayle and Damián Silvani are Co-founders of Dymaxion Labs, an Argentinian start-up that’s applying advanced machine learning and computer vision techniques to land use planning. Recently, they built a map to help policymakers estimate the growth of slums and informal settlements in South America. They’re using Rasterio, our open source tool for reading and writing raster datasets in python, to process and manipulate satellite imagery.
Informal settlements in South America are growing at an alarming rate, transforming peri-urban landscapes in a matter of months in some areas. Governments and NGOs struggle to keep up with surveying these changes because of the costs and logistical hurdles of covering the territories involved, meaning that data about informal settlements is often far out of date.
Inspired by publications on using machine learning and satellite imagery for land cover classification, we decided to build a tool that could automatically estimate the growth of slums and informal settlements. This would provide policymakers and NGOs with current data to inform urban planning policies and service provision.
Our online map now displays coverage of detected slums and informal settlements for Argentina and capital cities of Honduras, Paraguay, and Guatemala. The vector layer can be downloaded in GeoJSON format, and it’s published with an open data license. Already NGOs and government officials have welcomed the tool as a positive contribution, landing us on the front page of one of Argentina’s leading daily newspapers. (Thanks to Mapbox for supporting us after the spike in mapviews!)
Our goal was to create a tool that could produce vector files with polygons of detected slums and informal settlements. We started with images from the Sentinel-2 satellites, launched in mid-2015 by the ESA as part of the Copernicus Programme — currently one of the highest spatial resolution satellites freely available. Next we had to:
Download and preprocess satellite images, using only those with few clouds and an acquisition date similar to a tagged vector file available from official surveys.
Slice the raster images into equal-sized tiles and separate them into two classes: whether they included a known informal settlement or not, based on the intersection with the tagged vector file.
Train a classifier (in this prototype, we used Random Forests) with the training dataset.
Download and tile new satellite images, run the classifier to automatically detect informal settlements within those new tiles, and then build a vector layer with polygons from those tiles.
Using open source libraries and scriptable tools was an important decision. Eventually, we will need to scale up the process to expand coverage and frequency, and currently, the data must be continually updated so the process needs to be automated.
One of the tools we first used was the Python bindings for GDAL, a well-known C library for manipulation of geospatial raster files. Because this provides a thin abstraction layer, it was at times cumbersome, especially when drafting tests on Jupyter notebooks. Just as we were about to build a wrapper, we found Rasterio, which not only solved this issue but also promised other useful features. In contrast to GDAL for Python, Rasterio looked much more Pythonicand intuitive, so we tried it out.
Benefits of Rasterio
Rasterio was the tool we needed for three main reasons:
Reading or writing raster files with Rasterio is no different than reading or writing any file in Python. It makes it easy to work with high-resolution rasters efficiently thanks to its windowed reading feature.
Concurrent processing is an out of the box feature: Python’s Global Interpreter Lock (GIL) is released often, so performing image processing in parallel (histogram equalization, etc.) is fast. Being able to squeeze our CPU cores easily is helping us to scale.
Rasterio has a straightforward design but also great documentation, bundled with example recipes for common tasks, so we had a working prototype in a short time. Being an open source tool, the support from both Mapbox and the community has proven to be invaluable.
What’s next
One of the biggest task ahead for us is improving our classification accuracy using deep learning techniques, like convolutional neural networks, which are currently the state-of-the-art in image segmentation. Using higher spatial resolution imagery would significantly improve the precision of land cover classification. We’re also fundraising to expand our map to other countries and major cities in Latin America.
We plan to expand our use of Mapbox tools. In our current implementation of the map, we are rendering the complete GeoJSON file, but this is expensive and a memory hog for the browser. We would like to explore using Vector Tilesinstead, and rendering them with Mapbox GL. This way, depending on the current position and zoom level of the map, only relevant polygons would be fetched and rendered. We have been testing this feature on a new project for flood mapping.
We will be contributing bug reports and fixes on these tools and look forward to working with Mapbox in the open source community!
As Mapbox’s new Diversity & Inclusion Lead, I wanted to share how we commemorated Black History Month this year and how tech companies with emerging Diversity & Inclusion programs can start to lay the foundation for embedding inclusion and equity into their workplaces.
Start at the top: Inclusive innovation
We kicked off the month with our VP of People, Zaina Orbai, hosting a Fireside chat on Inclusive Innovation with the DC Mayor’s office. Our Head of Global Communications, Leslie Nakajima, led the charge here.Our CEO, Eric Gundersen, and the Deputy Mayor for Planning and Economic Development, Brian T. Kenner, focused on how tech companies can continue to create products that benefits those outside of the “tech bubble.” Eric and Mayor Kenner discussed how business and government could take the lead in building an ecosystem to enable founders, leaders, and individuals from all backgrounds equal access to opportunity. We looked at how the public and private sector can partner to be intentional about where we find candidates, who we hire, and how we treat people once they join.
This event was an opportunity for our leadership to make and affirm our commitment to building a diverse and inclusive team while elevating the conversation to include tips for startups to get diversity right from the beginning. Washington, DC — where Mapbox began — and the surrounding area is home to one of the largest concentrations of talented and educated people of color, and the fireside chat concluded with discussion of how this advantage can lead to better representation of minorities in tech.
Don’t dismiss the small changes: Raising awareness
Speaking of intentionality, our Employee Experience team handed over the reigns of our weekly “Friday Fun Facts” newsletter to members of our Black affinity group at Mapbox, Shades. This was a fantastic way to raise awareness around Black History Month by integrating it into our existing workflows.
Although this was a somewhat small development, I overheard hallway conversations like, “I had no idea Tupac took ballet classes!?”, appealing to popular culture or “I like how we’re shedding more light on Black explorers like Matthew Henson,” appealing to our company’s explorer culture. There’s nothing small about starting conversations and raising thoughtful awareness around minority community history and current events.
Fun facts, but sometimes just informative facts.
Draw inspiration from new places: An astronaut in kente cloth
At Mapbox, we think about the Black experience through the lens of the African Diaspora, meaning we view it as a global, varied experience. This year we aspired to commemorate Black History Month in new ways. We used this opportunity to create a curated item for Shades, the Black affinity group at Mapbox, to pay homage to the culture- past, present, and future.
We tapped Jazzy Winston, whose visionary style and thoughtful design process fit our objectives. Jazzy was inspired by the vibrant colors and patterns of traditional Kente cloth and fashion forward people of Wakanda in The Black Panther. Our point of interest marker was dipped in bright, contrasting patterns and colors, to point to African roots. The backdrop is jet black to inspire a sense of reflective pride in what it means to be Black in the United States.
A final touch was the addition of a quote from Dr. Mae Jemison, the first African American woman astronaut, “Never be limited by other people’s limited imaginations.” If you haven’t noticed, space and astronauts are a key part of our brand and identity at Mapbox. Historically, African culture and heritage was passed down by word of mouth from generation to generation, otherwise known as oral tradition. Thus, it was important to include the spoken words of an astronaut pioneer to speak to our present and pay homage to our past. We placed the quote on the shoulder to carry the oral tradition forward.
The muted green is actually part of our secondary color group.
Engage first, recruit later:The Fresh Prince meets tech
Our celebration of Black life and culture culminated with a celebration of 90’s music and culture at the Nextplay’s Black History Month Jam Session, co-hosted with our friends at Optimizely. We deployed hiring managers, recruiters, and other team members whose mission was to simply get to know a culture different from their own, meet members of the Black and Latinx tech community, and build relationships with attendees after the event. This is long-game inclusive recruiting. The strategy here is to build relationships with budding talent in the Black and Latinx tech community — before the applications, before culture fit assessments, before placing them into an environment that may not be ready for them.
Eric Gundersen was the lightning talk r̶a̶p̶p̶e̶r̶/̶d̶a̶n̶c̶e̶r̶ speaker. Before his chat began, he jammed out to the theme song of 90’s hit TV show, The Fresh Prince of Bel-Air, while the mostly millennial crowd recited the lyrics like it was the pledge of allegiance to the 90s.
After the flashback sing along, Eric shared how Mapbox, from the beginning, has been deeply invested in building out the best teams in the world and that the best teams are made up of individuals that come from a wide range of cultural, ethnic, social, and economic backgrounds.
Eric telling the host about his favorite 90s TV show, The Fresh Prince of Bel-Air.
But, like, how did you get your CEO to actually show up?
Executive support is key to making Diversity & Inclusion work. That’s why we apply the top-down method. The members of our executive team are enthusiastic — and downright tenacious — about getting involved in Diversity & Inclusion initiatives.
There’s nothing humble about the brag I’m going to drop. As we ramped up for the Jam Session event, Eric earnestly stated, “Whatever you need, I’m there,” and he meant it. Mapbox has always been committed to building teams that represent the world we live in and engaging with underrepresented communities. Before we became one of the major players in the mapping industry battle, we were in the Congo, in Afghanistan, and in Nigeria helping local governments map out flooding, deforestation, and monitor elections, and we have not lost that as we’ve grown.
Mapboxers, including members of the Talent Acquisition team, and Eric.
This is just the beginning…
Today marks the start of Women’s History Month. We’re kicking off the month by sponsoring and sending 16 team members to the Lesbians Who Tech Summit. Then we’ll celebrate International Women’s Day with a panel that raises the profile and celebrates the international women at Mapbox, followed by an open forum hosted by the Gender Minority ERG at Mapbox.
Finding Wakanda at Mapbox was originally published in Points of interest on Medium, where people are continuing the conversation by highlighting and responding to this story.
This is Part I in a series of projects for understanding and analyzing healthcare provider data. Derive business insights from spatial data using this workflow for building a dashboard app with QGIS, Tableau, and Studio.
Healthcare providers have a lot of data to analyze. Tableau makes it easy to understand big data. Mapbox makes it easy to create detailed maps for web and mobile platforms. Both of these tools work together so providers can build dashboard applications and manage all of their data in one place.
For this project, I created a dashboard exploring how many people live near healthcare facilities. I imagined this would be useful for resource planning internally, but you could expand the concept to consumer-facing tools, for example, a map interface where customers can search for in-network providers. I’ll walk through my entire workflow for creating the map, styling the data, and building a dashboard using only visual tools — no coding required.
Click through to explore the dashboard
Start building the background map
Using my NASA EARTHDATA account, I downloaded the 2015 Gridded Population of the World from NASA SEDAC (Socioeconomic Data and Applications Center) in GeoTIFF format, where the grids represent approximately 1 square kilometer with the count of population at each grid.
Population Count v4.10 2015, Gridded Population of the World. Courtesy NASA/SEDAC/Columbia University in the City of New York
Getting the map ready for Mapbox using QGIS and Tippecanoe
All of the gridded earth population data I downloaded is in raster format — a spatial data structure comprised of pixels encoded with data values. For the dashboard, this data needs to be converted to a vector format, where the data is displayed with symbolic shapes (points, lines, polygons) as opposed to pixel values. Vector data has vertices and paths so it’s easier to do an analysis of where the grids of population values intersect with Health Facilities data.
I used QGIS, an open source GIS software tool, to manipulate the data so it’s ready to be viewed in a web dashboard.
Add raster data to QGIS: Menu → Layer → Add Raster Layer (navigate to the downloaded GeoTIFF)
GPW v4 with Population Counts GeoTIFF Raster in QGIS
2. Add a vector layer for making base map: Menu → Layer → Add Vector Layer (navigate to USGS TIGER/Line® ESRI Shapefile “States”). Save the Vector Layer with the same projection as the Raster (WGS 84: EPSG 4326). We are going to “Clip” the world raster image with the States file — the area of interest.
3. Clip raster data: Menu → Raster → Extraction → Clipper → Input Layer (Raster) & Mask Layer (Vector) and select the “crop the extent” option | Output is the Clipped Raster.
Clipping GPW v4 GeoTIFF with USGS Tiger/Line ESRI Shapefile States as a Mask
4. Convert raster to vector: Menu → Raster → Conversion → Polygonize → Input Layer (Clipped Raster) and choose the Field Name option with a field name of Pop1Km | Output USAPOP1KM.geojson file for the background map. Essentially, I’m creating a vector from the raster image.
Output USAPOP1KM.geojson file rendered using QGIS
The USAPOP1KM.geojson is a huge file (1.6Gb) so I used Tippecanoe to generate Mapbox Vector Tiles, an efficient format for our web dashboard.
Tippecanoe is a Command Line Interface tool. I typed “cd” in my Mac OS terminal to navigate to the directory where the converted GeoJSON is saved. I then typed:
What that is doing is instructing Tippecanoe to output Mapbox Vector Tiles with a name of USAPOP1KM.mbtiles, a minimum zoom of 4, and a maximum zoom of 12, using the USAPOP1KM.geojson file. The -aN switch dynamically combines small features. This helps with file compression by coalescing the polygons.
Use Mapbox Studio to customize the map for Tableau
I uploaded USAPOP1KM.mbtiles as a tileset in Mapbox Studio and created a new layer called Health. I chose the Mapbox Dark style for the base map and then added the USAPOP1KM tileset. I styled the layer with the same color and breaks as I used in QGIS, setting the opacity to 25%. This allows the base-map detail to show through.
USAPOP1KM visualized in Mapbox Studio
Clicking “Share, develop, & use”, the button next to the style list, gives you the integration URL so the map can be referenced in Tableau.
Select Tableau from the list:
Adding this map to the Tableau dashboard we’ll build later is as simple as copy/pasting the link.
Open file in QGIS: I saved the Shapefile as 4326Structures.geojson with a CRS of EPSG:4326 (the same as our background map).
Saving the USGS Structures ESRI Shapefile as geojson with EPSG:4326 WGS 84 projection
2. Filter data: I then filtered the dataset for Health Facilities based on FTYPE = 800 as per the Best Practices Model.
Filtering the dataset for Health Facilities
3. Get pop value for each grid: Next, I Intersected the Health Facilities with the USAPOP1KM.geojson file to obtain the population value for the grid the point is in (Menu → Vector → Geoprocessing → Intersection | output file IntersectionPop.geojson)
Intersecting Health Facilities with Population Grid Values
4. Get County names: I intersected the IntersectedPOP.geojson with the USGS TIGER/Line® ESRI Shapefile “Counties” file to obtain the name of the County that the point is in (remember to save the Counties file with a CRS of EPSG:4326 first)
5. Save as CSV: I saved the output as HEALTHFACILTIES.csv and obtained the Latitudes and Longitudes values by setting the Geometry to the AS_XY option.
Saving the Dataset as CSV with Latitude and Longitude values
How I built the Tableau dashboard
Import the CSV into Tableau: Connect → Text File → Navigate to HEALTHFACILTIES.csv
Create two worksheets: Call one Map and the other Chart
Set geographic role: Change “X” to Longitude and “Y” to Latitude
Changing the Geographic Role in Tableau
4. Create the chart: I set up the chart worksheet as a dual axis “lollipop” chart with a Calculated Field for color to match the breaks of the background map.
Calculated Field for Dual Axis Lollipop chart in Tableau
5. Add the map: I set up the map worksheet as a scatterplot, with X on Columns and Y on Rows, and cut/paste’d my Mapbox Integration URL (Menu → Map → Background Maps → Map Services → Add → Mapbox Maps)
Adding a Mapbox Background Map by cutting and pasting the Integration URL
6. Finishing touches: Finally, I built out the dashboard by adding the worksheets and the filters (Menu → Analysis → Filters) with a Title and a caveat that recognized the data sources. I then published to Tableau Public (Menu → File → Save to Tableau Public).
Click through to view the dashboard on Tableau Public
You can click through the image to explore the finished dashboard (best viewed on a desktop).
What’s next
This dashboard was made with open data. Anyone with a Mapbox account and Tableau Public can replicate the project and extend it to their needs. For example, healthcare providers could use this tool to identify in-network and out-of-network facilities and allocate resources in a way that maximizes accessibility for patients. Although the dashboard shows the population counts for the United States, it’s entirely possible to scale this to the whole world.
Mark Hartley just joined the People team as our new Head of Talent Acquisition supporting business teams. He brings over twenty years of recruiting, management, executive search, consulting, and advisory experience to Mapbox.
Mark comes most recently from Twilio where he was leading recruiting for GTM, G&A, Business Operations, and Executive Search. He grew Twilio from 100 employees to 1000 as they transitioned from a private company through their IPO. He is also an advisor to Sway Ventures, an early stage Venture Capital firm. Mark will work closely with our COO, leadership, and business teams to hire and onboard the best talent globally.
Mark’s leadership and consultative style will ensure we’re hiring the right talent into the right roles. We’re looking for diverse team members to build the next layer together. Build with us, grow with us!
Open Listings is targeting tech-savvy homebuyers with a “you find the home, you keep the savings” model. Users can find a property on their website or app (or any other listing site) and buy it directly through Open Listings, as opposed to a real estate agent. Open Listings receives the entire buyers agent’s commission (typically 2.5% or 3% of the purchase price) and refunds the homebuyer 50%.
Because real estate is all about location, Open Listings wanted to customize the map experience to drive user engagement.
I can’t stress it enough. People spend more time onsite; end up visiting more properties per visit; they are more likely to schedule a tour; they engage further with the product which gets them more bought in if they have the context of where things are and what’s nearby. Maps are a crucial function of the business. -Kevin Miller, Director of Growth
Hovering over a map icon while scrolling property images reveals a map
Currently, Open Listings supports two states, California and Washington. With just two states, they’re indexing over 5 million web pages from over ten different brokerage search engines. As the business grows — potentially indexing hundreds of millions of pages — they realized they need a scalable map solution, both in terms of price and performance.
Google became cost prohibitive. The customer service experience was poor. It really was surprising. Our engineers felt Mapbox was incredibly developer friendly and great for integration. Maps are a major function of pages on our website so the performance and customization and how much dev time it would take are what weighed that decision.
And the switch went well:
It took one developer about three weeks to get feature parity with our old maps. Support has been really easy to get ahold of when we run into snags. -Peter Sugihara, Co-founder and Chief Product Officer
The newly designed desktop experience
Open Listings uses GL JS, our web API, and our Maps SDKs for Mobile to customize the presentation of map data, build in interactivity, and render vector maps on the client at 60 frames-per-second (the speed of a video game). The design team used Studio, our visual design suite, to tailor the map style to the experience.
Mapbox enabled us to customize the map design for different contexts. The default map styles provide rich interactions that help users shop for homes, where it’s crucial to understand how close a property is to schools, highways, public transportation, shops, and the like. But it was also important for us to communicate sales volume by region. In this context, it’s less about understanding the exact location of a single property and more about understanding the market at a high level.
We used Studio to design a more elegant, understated map so that the markers stood out more than the specifics of the geography. We went through countless pin designs with Google Maps, and the end result was either ugly or ineffective. Once we switched to Mapbox, it was clear that the solution was to be able to customize the map, not the pins. -Monica Kogler, Design Director
Clustering by zoom level makes it easier to explore thousands of property listings at once
In the near term, Open Listings is planning to use our Geocoding API for address search on web and mobile so users can search for properties near a specific business or location. Also on the roadmap is incorporating directions and traffic data on the maps, showing commuting distances and times, as well as routes to local points-of-interest.
Mapbox offers us an incredible level of map detail and customization that we couldn’t find with other providers. It’s the kind of tech we want to align with because it gives us the flexibility to build a unique and personalized product. -Kevin Miller, Director of Growth
The 2018 hurricane season was among the most destructive and deadly on record. Seventeen named storms battered the Caribbean and American Gulf Coasts, killing thousands and causing hundreds of billions of dollars in damages. Since working on this visualization of the impact of Hurricane Maria on regional mobility in Puerto Rico, I’ve been curious about the spatiotemporal patterns of mass evacuations.
How long before landfall do people evacuate? Which routes do they take when they go? What are the similarities among evacuation events for different storms?
At this week’s #SmartDev2018 conference, hosted by the World Bank and the Center for Effective Global Action, I explored these questions using three of last year’s major storms as case studies: Hurricane Harvey, Hurricane Maria, and Hurricane Irma. Anonymized data from our global traffic sensor network provides valuable insight into regional patterns of mobility and connectivity in over forty countries. Using this location data, we can model how and when people evacuate from hurricanes and storm events around the world.
The path of Hurricane Irma and the other 2018 Atlantic Hurricanes
Initially, I was curious about the timing of when people are on the road during an evacuation. To investigate, I added up the total volume of traffic on all the roads within a 3° latitude by 3° longitude box. For Puerto Rico, there is a major spike in total volume the evening before Hurricane Maria makes landfall.
I repeated this analysis for Southeastern Texas during Hurricane Harvey and South Florida during Hurricane Irma. Each of these time series shows a precipitous volume spike in the evening before the storm hits. The timing of these spikes is consistent with a cohort of people waiting for the conclusion of the work day before evacuating.
Spikes in volume prior to hurricane landfall indicate many people tend to wait until the workday is over before evacuating.
Next, I looked at the routes chosen during pre-storm evacuations. It is common to see images of miles-long traffic jams of people evacuating from impending storms. I found that this congestion is common not just on interstate highways but on all roads that can be used for long-distance travel, such as state and county routes. To illustrate, I compared a typical Friday rush hour in Southeastern Texas with the Friday night before Hurricane Harvey made landfall.
On a normal Friday night, the majority of the intercity travel occurs along the Interstate 37 corridor between Corpus Christi and San Antonio. However, during the evacuation, traffic is widespread on a host of alternate routes between these two cities, as well as on routes that connect Corpus Christi with Victoria and Houston.
During an evacuation, drivers chose alternate ways of getting between towns, often favoring state and local routes.
In this case, primary roads (state highways) increased in volume by approximately 150%. Secondary and tertiary roads (county highways and local routes) also experienced 50–75% increases during evacuation when compared to the baseline.
When compared to a baseline, there is often a large increase in travel along lower-capacity routes during evacuation events
In other words, roads designed to carry low volumes of vehicles at low speeds are essentially functioning as freeways during evacuation events. This can be especially dangerous for drivers choosing to take these roads in the inclement weather that accompanies an impending storm.
These patterns found in Southeastern Texas are indicative of trends seen during other evacuation events as well. For instance, secondary, tertiary, and residential roads in Southern Florida had 50–100% more traffic during the Irma evacuation than during a typical rush hour. While the exploration has so far focused on Atlantic hurricanes, our global traffic coverage means we can analyze the effects of storms in diverse regions across the globe.
Cyclones all over the world are projected to increase in frequency and severity over the coming century. As we observe future evacuations, we could build up a model capable of predicting the volume of any given road segment during an evacuation. State and local governments could use this model to assess the readiness of their infrastructure and to properly position emergency resources prior to a hurricane.
Traffic volumes in Puerto Rico on Monday, October 23 — anonymous sensor data can be used to assess the aftermath of storms as well
At the #SmartDev2018 conference, I spoke with a mix of academic researchers, machine learning engineers, and development practitioners about how we could use our mapping tools and real-time traffic data to bring this model to life and keep people safer during evacuations.
Learn more about using our platform for humanitarian causes. If you’re using maps and location data for positive social and environmental change, reach out to our community team: community@mapbox.com. Follow the Community tag on Medium to read more about humanitarian projects built with Mapbox.
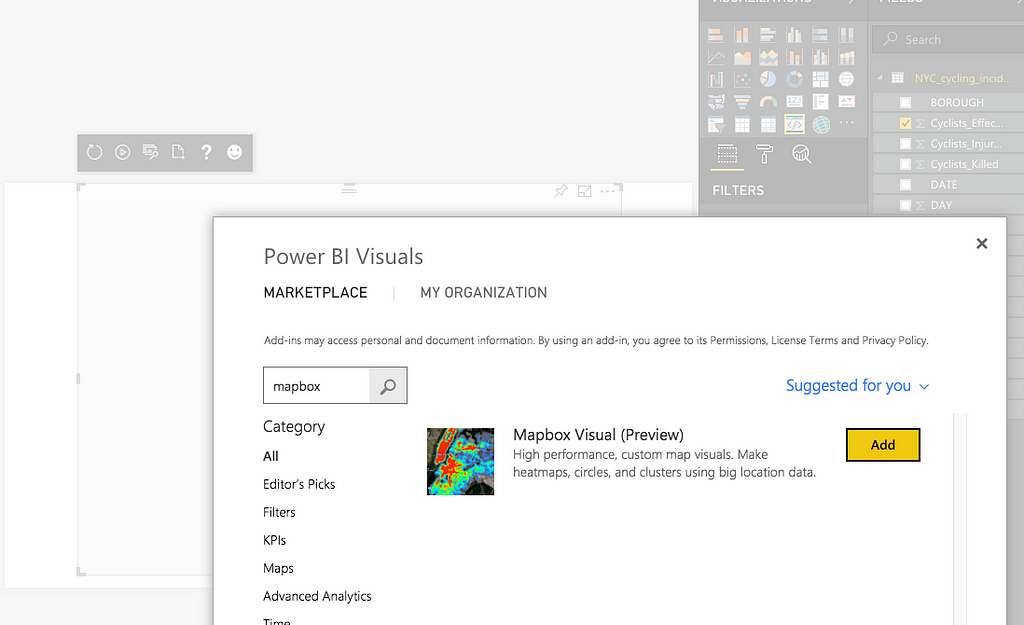
Here’s a rundown of the new plugin now available in Power BI:
Customizable visualizations
Use the plugin to explore your data as interactive heatmaps, graduated circles, or clusters. Add multiple data visualization layers to the same map and change visibility based on zoom.
Fast rendering
Filter and explore tens of thousands of data points with the fastest maps on the market, rendering vector tiles on the client at 60 frames-per-second (the speed of a video game).
Total design control
Add any of eight Mapbox map styles tailored for data visualization directly in Power BI, including high-resolution satellite, terrain, and traffic. Build a custom map style in Studio, and import it into your dashboard with one click.
Cluster by property value
Understand data minimums/maximums, sums, and averages with property aggregation for clustering. For example, find the maximum earthquake magnitude by region and month in 2017, not just earthquake density.
Import custom data
Upload massive point, line, or polygon datasets in CSV, Shapefile, KML, GeoJSON, or GeoTIFF format. Add the data to your dashboard as a custom map style, such as a shapefile of neighborhood boundaries and names in New York City.
Getting started
To use the Mapbox Visual for Power BI, you’ll need a Mapbox account and a Power BI Desktop account. Grab the Mapbox Visual for Power BI from the Microsoft Office Store or directly from your Power BI dashboard. Just click add from marketplace and search Mapbox.
For full step-by-step instructions, including getting started with the plugin, check out this tutorial.
Are you a business intelligence developer? The Mapbox Visual for Power BI is open-source on GitHub. Pull requests and issue tickets for bugs and features are welcome.
What’s next?
Send us a tweet @Mapbox to show us what you build. If you want to extend the visual in a custom Power BI implementation, drop us a line or add a feature request on the project’s open-source GitHub repository.
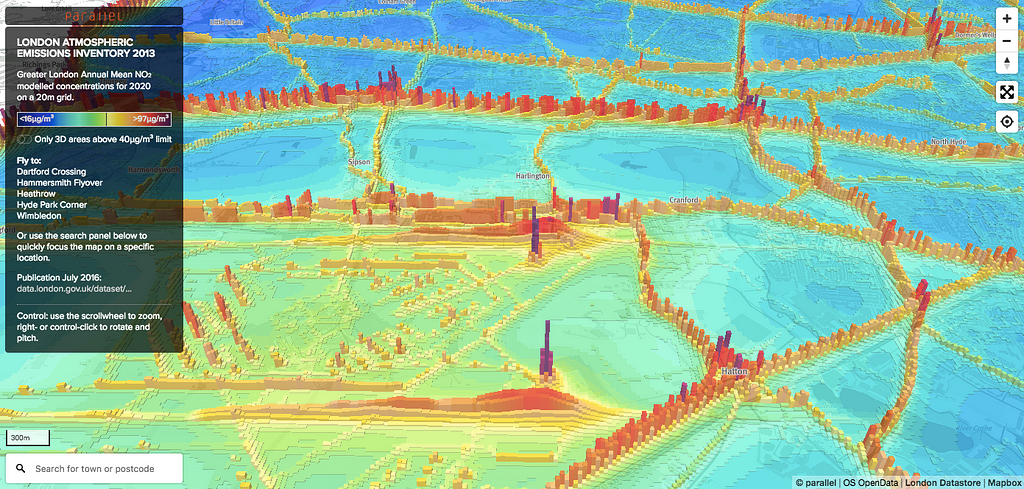
Parallel specializes in mapping and data visualization with a focus on the UK healthcare sector. They use Studio and GL JS to render data-heavy map tiles, style basemaps and data overlays, and add interactivity to maps. Ashley Clough, founder of Parallel, shares some of their recent data explorations with our tools and why he uses our stack:
We love using Mapbox because of its open source ethos, incredible power, and particularly the relentless innovation: extruded 3D polygons — we love making city maps with those; heatmaps — whole new opportunities for massive datasets; GL terrain — an amazing, almost instant update for many of our existing styles. I lurk on Github and Mapbox.com waiting for the next bit of functionality to explore.
1. Heatmap with isochrones for 30,000+ schools across England and Wales
We were looking for an opportunity to use Mapbox GL heatmaps for a large point dataset (neatly processed using Tippecanoe) and link it to the dynamic isochrone generation tool we use. We wanted to give anyone the opportunity to create an isochrone around their local school and explore thousands of other schools.
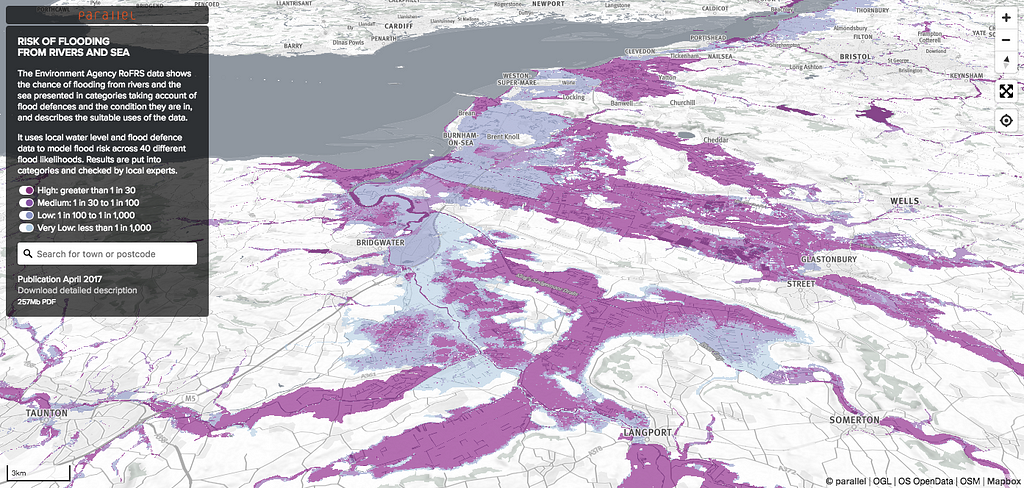
We’ve been processing the UK Environment Agency’s data for several years. The combination of interactive GL maps and the new dynamic, hillshade terrain rendering proved irresistible for presenting the latest variation of flood risk data on one of our OS Open Map Local basemaps.
After we’d explored extruding 3D buildings in cities using LIDAR datasets, we thought it would be interesting to try rendering some virtual cities from other interesting datasets. The London air quality data in 2D doesn’t quite show the variation in concentrations across the city, but in 3D, using the extruded polygons in Mapbox GL, the ends of the runways at Heathrow stand out as literal high points.
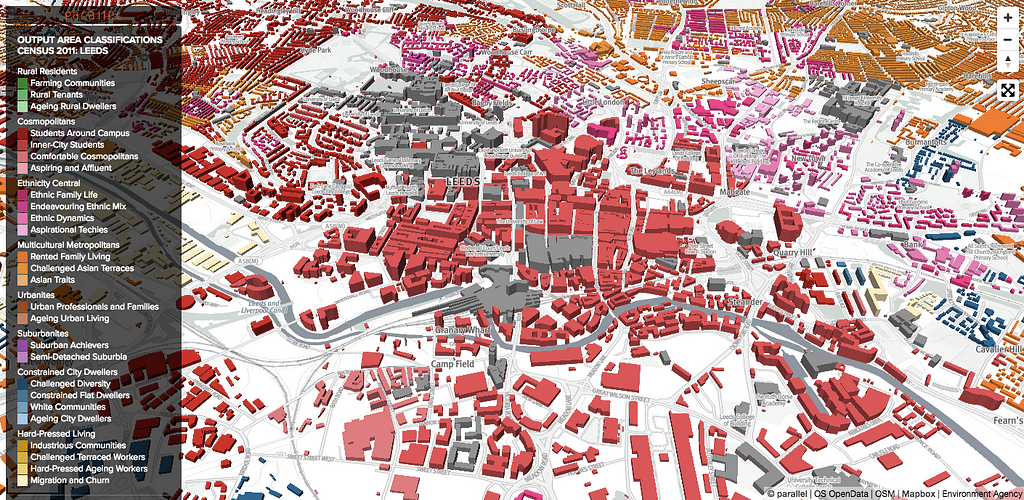
In our home city of Leeds, we’re constantly looking to map local open datasets. This combines national Census data with 3D building heights and locally-modeled building profiles (created in QGIS and stored in a PostGIS database). It allowed us to colour-code most of the city’s buildings and identify the types of people that live in the local areas.
This is another 3D data rendering. With the time series population projection data for the wards in Greater London, we can let the user animate and filter the data over time. The data was processed by PostGIS, output as a tileset in Studio, and then rendered on-the-fly using Mapbox GL JS. Using the web API we can extrude and colour the ward areas based on both the population count and the percentage change from the base year.
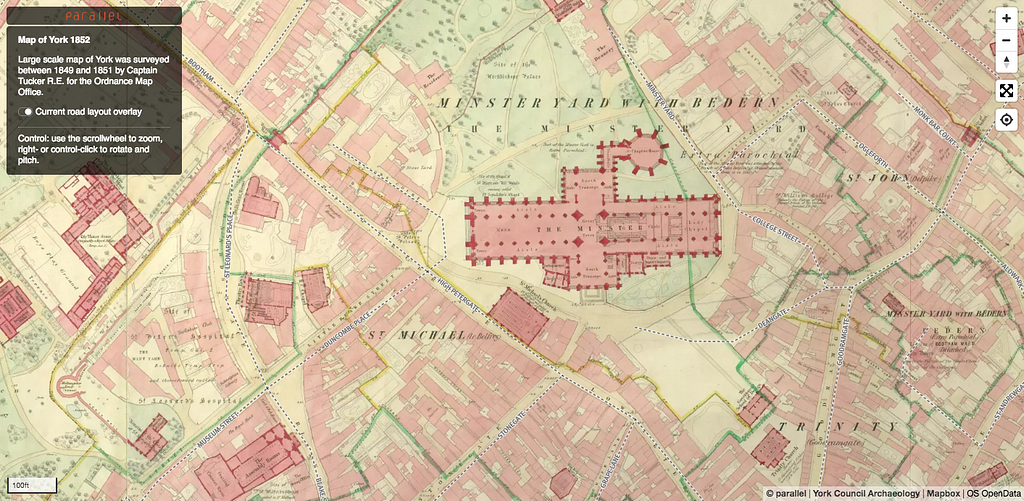
We persuaded the City of York Council to let us have copies of the 15 large, high-resolution scans of the original maps. These were then all stitched together in Photoshop creating an enormous 25k x 23k pixel image that was then georeferenced in QGIS and rasterised in Studio [like this tutorial]. It’s a hefty 3Gb tileset but worth it when you’re walking around the city and the map is updating its location on your mobile phone. Reading the map annotations is made easy by the infinite zooming and rotation capability of the GL API.