Quantcast
Channel: maps for developers - Medium
Viewing all 2230 articles
Browse latest View live

Cloudless Atlas with Landsat

$
0
0
This is a peek at the next release of our Cloudless Atlas release that the satellite team is prepping. Our goal is simple: to create cloud-free imagery mosaics from satellite imagery at ever higher resolutions for the entire world.

This is a peek at the next release of our Cloudless Atlas release that Chris and Charlie on the satellite team are prepping. Our goal is simple: to create cloud-free imagery mosaics from satellite imagery at ever higher resolutions for the entire world. This new cloudless imagery will be rolled out to MapBox.com later this summer in addition to being available for our behind firewall products using vector tiles.

Southern Spain

Algeciras, Spain, and Gibraltar

Landsat 8 – The Future

This latest work with Landsat has us well positioned for future imagery processing. The big news in satellite imagery this week is that Landsat 8 is coming online. The Landsat program has run for more than 40 years, providing an unparalleled visual record of the Earth’s surface, and Landsat 8 promises to bring cleaner, more colorful images than ever. The satellite team has been working with the sample data that’s been released ahead of the official handover from NASA (which launched it) to USGS (which will operate it and provide the imagery), and they report that the new images look terrific.

The Landsat program has run for more than 40 years, providing an unparalleled visual record of the Earth’s surface, and Landsat 8 promises to bring cleaner, more colorful images than ever.

One reason Landsat 8 is so important is that its predecessor, Landsat 7, has suffered from a mechanical error for the last decade. Landsat 7 assembled images by moving a series of mirrors in zig-zag fashion to collect one small strip of imagery at a time – panning back and forth (as seen in the screenshot above), the way you might examine a large object through binoculars. But on May 31st, 2003, a small part broke and the mirror system no longer compensated for the satellite’s orbital motion. The image swaths no longer adjoined properly, and lines of missing data appeared:

Landsat 8 uses a new sensor system – it works a lot like a desktop scanner – to provide cleaner data more reliably. At the same time, it has sensor upgrades from Landsat 7, so it captures colors more faithfully. You can expect to find Landsat 8 imagery in our satellite layer for years to come.

Even though Landsat 8 isn’t online yet, we were able to smooth these images of Gibraltar from Landsat 7 by adapting the algorithms and processes we developed to remove clouds – basically we remove missing data exactly as if it were clouds. All the images in this post are produced from Landsat 7 data.

Landsat 7 images for path 201, row 35 (Strait of Gibraltar), captured between 1999 and 2013

The same images as they proceed through the null- and cloud-removal process

Output, with preliminary post-processing for angle and color. This cloud-free composite uses 30m Landsat imagery for the Strait of Gibraltar, with Spain on the north and Morocco on the south

In short, at the same time as we look forward to years of high quality Landsat 8 data to come, we’ve found a way to make good use of the last 14 years of Landsat 7 data, even SLC-off images that had seemed unusable until now.

We will continue to post status updates on Twitter via @MapBox, and Chris (@hrwgc) and Charlie (@vruba) on the satellite team always appreciate technical questions.


Washington Post Goes MapBox to Heat Map DC's Gun Seizures

$
0
0

The Washington Post used MapBox maps to build a fantastic interactive visualization of gun seizures in the District of Columbia and suburban Prince George’s County since 2000. Using a heat map on top of our MapBox Streets basemap, the Post’s data journalists visualized almost 50,000 geolocated incidents. They also offer an excellent illustrative video that plots the data from the Bureau of Alcohol, Tobacco and Firearms over time.

MeatText Arrives on Android

$
0
0

MeatText is an app that allows you to quickly share your location with friends, even if they don’t have the app! You can even customize the map style and animated icon to share your location with style. You share it via message, email, twitter or copy it. And now it is available on Android!

Check out MeatText in the Google Play Store or in the Apple App Store.

Previewing User Interface Improvements in iD Version 1.1

$
0
0

Now that iD, the open source map editor, is live on OpenStreetMap.org we are investing in the details to make editing the map even easier and more intuitive. We are days away from the new release of iD version 1.1, here is a preview of the new user interface improvements you can expect.

New hover state for previewing features. On hover, we hide buttons, form elements, and links for a distraction-free view.

We've done away with the slide-in sidebar, trading a bit of map space in order to provide a new way for users to interact with map features: hover over a feature, and you'll see a summary of its attributes before clicking. Once you click, the summary fields smoothly transition into editable form fields. The hover state is useful for quickly scanning a region of the map for missing or incorrect tags: a simple, easy task for new users looking to get their feet wet with OSM editing. The persistent sidebar also brings performance improvements as we no longer need to push the map over to make way for the sliding sidebar.

There are a few details to this interaction that I'm particularly proud of. In hover mode, forms with multiple options collapse into a single field, succinctly showing the correct value. Then, on click, that field expands to include all the options. Watch the transition on the "structure" field on the subway:

REXML could not parse this XML/HTML: 
<p><iframe class="vine-embed" src="https://vine.co/v/bY1h5g7V9HH/embed/simple" width="480" height="480" frameborder="0"></iframe><script async src="//platform.vine.co/static/scripts/embed.js" charset="utf-8"></script></p>

We're currently in the concepting stage for the "default" state - what do we show in the sidebar if the user isn't hovering over anything? There's an issue open about this now.

REXML could not parse this XML/HTML: 
<p>One of the other details we'll be rolling out with 1.1 is a more intuitive way for users to change the feature type on a feature that's already been defined. Just click on the icon in the header to get back to the full feature listing:<p>

<p><iframe class="vine-embed" src="https://vine.co/v/bY1MDn2q0Ve/embed/simple" width="480" height="480" frameborder="0"></iframe><script async src="//platform.vine.co/static/scripts/embed.js" charset="utf-8"></script></p>

<p>This is small sample of some of the UI changes that are coming on the horizon for iD. From the beginning, one of our top priorities has been to make this tool as elegant and user-friendly as possible, and there's still plenty of work to do on those fronts. Expect tools for editing relations, a revamped save work flow, and more, soon.</p>

<p>To give the most recent, cutting-edge iD build a test run, head to <a target="_blank" href='http://openstreetmap.us/iD/master/'>openstreetmap.us/iD/master</a>.<p>

See the Freshness of OpenStreetMap Data

$
0
0
US OpenStreetMap Edits

The colors in this map of the United States indicate how recently each road has been edited in OpenStreetMap: the oldest data in yellow, the newest in magenta, along a spectrum from Charlie’s sinebow algorithm. The recent bot edits expanding street names stand out in the east.

The image comes from a tool I’ve been working on for visualizing the OpenStreetMap GPS track collection for a workshop at State of the Map US next week. It also turns out to be helpful for visualizing aspects of OpenStreetMap itself, which Tom and I are doing for the OSM Data Report session on Saturday.

Data © OpenStreetMap contributors.

We're Supporting OpenStreetMap's Funding Drive for New Servers

$
0
0

We are supporting the OpenStreetMap Foundation’s $60,000 (£40,000) funding drive for new server infrastructure with a contribution of $20,000. If you hold a stake in OpenStreetMap large or small, we encourage you to chip in, too.

OpenStreetMap GPS Tracks by Eric Fischer

The OpenStreetMap Foundation’s Operations Working Group plans to spend the newly raised funds on a full hardware replacement for the existing server powering OpenStreetMap’s core read/write API. This upgrade comes at an important time for OpenStreetMap.org which continues to grow doubling its registered user count over the last year and handling over 10,000 edits every single day.

According to Andy Allan from the Operations Work Group, this investment will allow OpenStreetMap to handle its explosive growth for at least over the next 12 months. Beyond this immediate hardware upgrade, there are plans to further split out functionality that would increase this time horizon. Scaling OpenStreetMap for years to come will be a larger conversation that we here at MapBox are looking forward to be a part of.

To contribute to this vital upgrade, just use the OpenStreetMap Foundation’s donation form. For any questions around larger contributions, please contact Simon Poole, chairman of the OpenStreetMap Foundation, directly. If you’re coming out to State of the Map US in San Francisco look out for Birds of a Feather sessions on fundraising and architecture for a future OpenStreetMap infrastructure.

Processing Landsat 8: First Look at the Northeast Mediterranean

$
0
0
Landsat 8 | Lake Burdur and Acıgöl, TurkeyLake Burdur and Acıgöl, Turkey · Landsat 8 

The new Landsat 8 imagery from USGS is amazing. We’re using the Aegean Sea and the western part of Turkey as a test area to look at adding it to MapBox Satellite, because the region has many interesting textures visible at Landsat 8’s 15 meter (50 foot) resolution.

The first images captured by Landsat 8’s Operational Land Imager (OLI) sensor are everything we hoped for – even in this early data, with clouds and seams and only preliminary color treatment, these features leap off the screen. What you’ll see below are examples of the kinds of things that we ooh and aah about in the office as we’re testing out new imagery.

Troy

This is the archaeological excavation of the ancient Hittite city of Wilusa, better known as Troy, site of the Trojan War. It’s in modern-day Çanakkale province, Turkey. To the west is the Karamenderes river, which the Iliad refers to as the Scamander. Even without the connection to the Homeric poems, Troy would be an important archeological dig, and it’s a UNESCO World Heritage Site.

Istanbul

Istanbul started as a settlement at a vital crossroads – where the Black Sea connects with the Mediterranean and Europe connects with Asia. Its strategic position brought it wealth and culture from the entire Old World. It’s been the capital of four empires, and the destination of both the Silk Road and the Orient Express. Today it’s one of the largest cities in the world. This view shows the center of the city, with the First Bosphorus Bridge to the south and the Fatih Sultan Mehmet Bridge (or Second Bosphorus Bridge) to the north.

Komotini

This is a typical small city (population 70,000) on the Thracian Plain of Greece. To its southeast is a sectioned-off industrial area with some bright red roofs. The green pocket just outside town to the northwest is the campus of Democritus University of Thrace. A branch of the nearby river used to run through the city, but it was prone to flooding and therefore was diverted in the 1970s – exactly the kind of land-use change that Landsat is good at tracking.

Open from the start

This data is all free and public domain, made available by a joint initiative between the U.S. Geological Survey (USGS) and NASA. You can download a Landsat 8 image and put it on a map right now – although I should warn you that the raw image files are a bit unwieldy if you aren’t used to large rasters.

The oldest of the images above is from just a few weeks ago, making this one of the most up-to-date medium-resolution satellite maps out there, and 400 new scenes flow into the archive every day.

All of us down here on earth are lucky to have Landsat 8 up there producing so much high-quality imagery. We on the satellite team feel particularly fortunate that we can get our hands dirty and start putting this lovely imagery to work. You’ll see more posts from us – that’s Chris (@hrwgc) and Charlie (@vruba) – as we find applications and techniques worth sharing.

WWDC 2013 Whiskey Geo Hour

$
0
0

If you’re at Apple’s World Wide Developer Conference (WWDC) in San Francisco next week, you’re invited to the WWDC Whiskey Geo Hour (WWGH) on Tuesday, June 11.

(See a bigger map)

Join MapBox for whiskey and your fellow iOS and Mac developers working on mapping, location, cartography, and navigation. Meet some new friends, sip some whiskey, and kick off your Tuesday night festivities from 6:00 to 7:00pm at the Code for America offices on 155 9th Street, just blocks from Moscone West.

Space is limited, so please RSVP soon if you plan to join us for the WWDC Whiskey Geo Hour. We hope to see you there!


State of the Map US in San Francisco this Weekend!

$
0
0

Over the next two days a good portion of the MapBox team is headed to San Francisco for OpenStreetMap’s annual U.S. conference. This year’s State of the Map US conference has come together to be one of the year’s premier geo events - which is incredibly exciting as it’s centered entirely on expanding open geo data and improving OpenStreetMap as the leading resource for it.

State of the Map US will be the largest gathering around OpenStreetMap ever - almost doubling the size of last year’s US conference in Portland. The diversity of attendees is pretty astounding. People are coming from technology companies like craigslist and foursquare using OpenStreetMap data in their applications, satellite companies looking toward open data, government agencies like the Census contributing to OpenStreetMap, schools and universities teaching how to use and edit the map, and from all over the geo space. We’re looking forward to meeting everyone, finding out what got them interested in OpenStreetMap, and seeing how together we can create the best global map there is.

The conference itself should be a blast. Our team will be leading workshops and sessions throughout the weekend, and of course a presence at the parties and happy hours planned for Friday, Saturday, and Sunday evenings. We’ll also have a table in the main Atrium - stop by for a demo of iD editor, TileMill 2, our latest cloudless satellite imagery, MapBox Earth 3D maps, plus a few new things we have up our sleeves.

To get in touch with anyone on our team, hit us up on Twitter at @mapbox - we’d love to talk. Also look for Alex and myself in the hallways and exhibit area, where we’ll be making sure that everything goes off without a hitch.

Dennis Luxen Joins MapBox

$
0
0

Dennis Luxen, the lead developer of Open Source Routing Machine, a high-performance routing engine, is joining the MapBox team. Dennis is an algorithm engineer at heart and just completed his PhD in computer science at the well-respected Karlsruhe Institute of Technology, Germany where he focused on highly scalable route planning algorithms and mapping services. We’re gearing up for what looks to be a very exciting summer.

Dennis Luxen

Mapping the NSA's Secret Data Center on OpenStreetMap

$
0
0

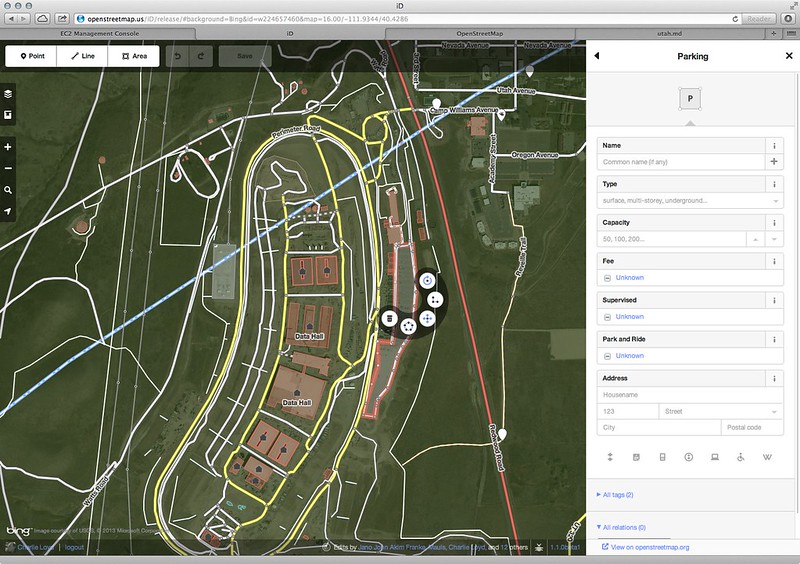
One of the most interesting new data centers in the world is under construction right now in Utah, just south of Salt Lake City. Despite being publicly owned, and one of the largest of its kind anywhere, it’s surprisingly hard to find open information on its details. As it happens, it’s owned by the NSA, which apparently has huge data processing needs. It won’t open until late this summer, but the OpenStreetMap community has already mapped it in detail from satellite photos, and you can find your way around it on our maps if you’re ever invited on a tour.

Tuning OpenStreetMap Editing: iD Editor 1.1

$
0
0

Just in time for State of the Map US this weekend, we’ve released a new version of the OpenStreetMap editor, iD version 1.1 beta. From new UI refactoring, to workflow improvements, to performance tuning, this release is ready for testing on our staging servers.

http://openstreetmap.us/iD/release/

As detailed in the roadmap, the 1.1 release focuses on relations editing support and performance improvements. We’ve also added significant functionality to the sidebar, which is now persistent on the right side of the editor. Here is a more detailed rundown of what’s new in iD 1.1.

Performance Improvements

As an advanced, web standards-based application, iD pushes the boundaries of browser support for technologies like SVG, CSS transforms, and high-performance JavaScript. In 1.1 we’ve worked hard on both iD’s own algorithms and its use of web technologies to make the editing experience snappier, particularly in dense urban areas.

In some cases, we’ve been able to make significant improvements. In others, we’ve found ourselves limited by underlying browser performance bottlenecks, particularly on Firefox. Fortunately, the Firefox developers are on the case, and if you edit with the latest Firefox Nightly, you should see significant improvements relative to Firefox stable releases. We’re eager to see these and further improvements make their way into Firefox. Until then, we recommend WebKit-based browsers for best performance.

Relation Editing

iD’s sidebar now displays relation memberships.

You can add, edit, and remove members from a relation, or edit the parent relations of a given feature.

To make relation editing more straightforward, we’ve added presets for common types of relations.

Improved Sidebar

In iD 1.0, the sidebar on the right slides in and out depending on your selection. This behavior sometimes got in the way, and the constant movement was a contributor to sluggishness. In 1.1, we’ve eliminated the slide-in behavior, trading a bit of map space in order to provide several new ways for users to interact with map features.

By default, the sidebar shows a list of the features currently visible. You can search by feature type or name to narrow down the list. Click a result to select and edit the feature – a handy way to get to relations that otherwise are not visible on the map.

Hover over a feature on the map and you’ll see a summary of its attributes.

Finally, when you’re ready to save your changes, you can continue that interaction within the same sidebar – no more modal dialogs.

Read more about the new sidebar design on the MapBox blog.

Once these features are tested and stable, we’ll roll iD 1.1 out on openstreetmap.org. Until then, please try editing OpenStreetMap with iD 1.1 beta on the openstreetmap.us deployment and report any feedback on our issue queue.

The 2013 OpenStreetMap Data Report

$
0
0

OSM Data Report

Today we are launching the 2013 OpenStreetMap Data Report, a beautiful and deep exploration of OpenStreetMap’s incredible momentum, its data and contributors. This report comes in time for State of the Map US 2013, the largest OpenStreetMap gathering to date, kicking off today in San Francisco.

We’ve looked back on the project’s 10 years in the making, the skyrocket growth to over 1 million users, 21 million miles, and 78 million buildings, and tried for the first time to tell the story of OpenStreetMap as a whole in data. We have traced through OpenStreetMap’s 67,629,368 roads and tallied up the incredible sum of 21 million miles - that’s 40 years of driving at 60 miles per hour.

What’s striking is OpenStreetMap’s growing global coverage and freshness of data. Working with the data artist Eric Fischer we have created these renderings of OpenStreetMap data, showing roads colored by currentness. Red roads have been edited most recently:

Tokyo

OpenStreetMap road data in Tokyo. Red roads have been updated most recently

OpenStreetMap road data in the United States. Red Roads have been updated most recently

OpenStreetMap is unique in being created and maintained by its users, so this report is as much about the data as it is about individuals: As examples, this report highlights the work of Ian Dees who lead a project to map thousands of buildings in Chicago, or Serge Wroclawski who wrote and operated a project to fix over four million contracted road names, or Frederik Ramm who investigated the most mapped areas on earth.

Chicago

Chicago before and after the building and address import

Eric Fischer and myself will give a talk about the OpenStreetMap Data Report at State of the Map in San Francisco on Saturday 2:15 PM Pacific time. If you can’t make it to the conference, you can watch the talk live on the conference web site’s video stream.

Post-Conference Happy Hour Tonight in San Francisco

$
0
0

We’re throwing a round for everyone still in town after State of the Map US

Here at the hub, the State of the Map US sprint day is in full swing. After a day full of hands-on updates to OpenStreetMap, we’re going to need some refreshments. Join us at 6.30 PM at the Irish Bank. The first couple of rounds are on us.

State of the Map US sprint day

Directions to Irish Bank from the Conference site:

Irish Bank
10 Mark Ln (at Harlan Pl.)
San Francisco, CA
Monday June 10 6.30PM

Photos from State of the Map US

$
0
0

The annual US-based OpenStreetMap conference took place this weekend in San Francisco, bringing out 380+ people to connect over OpenStreetMap. A good crew from MapBox was there talking about the iD editor, vector tiles, OpenStreetMap design, the OpenStreetMap data report, and much more. We will post videos and slides from those talks later this week.

I served as the official photographer of the event and got some great shots of the weekend’s activities. Below is a quick look at the MapBox team at State of the Map US. Check out the full set from the conference over on Flickr.

Tom kicking off his talk on the iD editor for OpenStreetMap.

Alex in a session, with Ansis in the background.

Saman talking about the openstreetmap.org redesign.

Bonnie listening in on a session with Michal Migurski and Aaron Straup Cope.

Artem talking about the latest version of Mapnik.

Eric shows Bronwyn Agrios the iPad app.

Ian demos TileMill and MapBox Satellite to Taichi and Satoshi.

Bobby in a birds of a feather session on TileMill.

Quick team scrum with Saman, Bonnie, and Ian.

(All photos were taken by Justin Miller. You can see more of his photography at Mallorn Imagery.)


GitHub Adds Maps

$
0
0

GitHub adds maps! Today’s launch allows any GeoJSON file hosted on GitHub to be rendered as a fully interactive visualization on top of a custom map designed to let the data stand out. Github is taking advantage of MapBox Streets’ new open source vector tiles, perfectly tailored to the company’s visual style, with a color palette that comes from GitHub’s branding and UI colors.

MapBox and Github sitting in a tree

Open by Design

.colorpalette { float:left; min-width:360px; width:100%; height:100px; margin-left:auto; margin-right:auto; padding-bottom:10px; } .colorswatch { height:100px; min-width:44px; width:13%;display: inline-block; } </style>

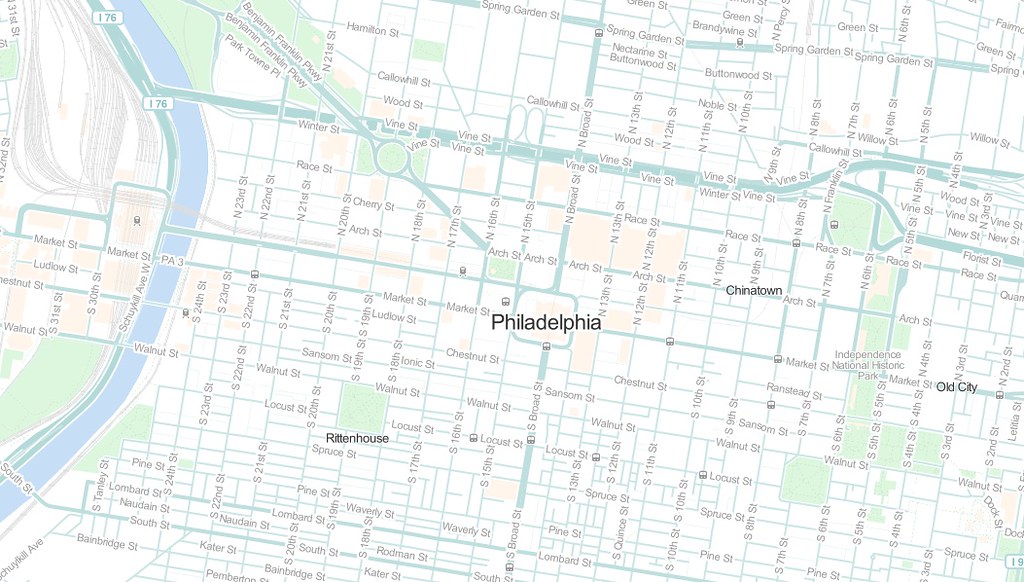
The basemap is designed to complement, rather than compete with, GeoJSON data layers and leverages the speed and customization of our vector maps, along with the global, street-level details of OpenStreetMap.

The overall aesthetic is kept light to serve as an unobtrusive baselayer for GeoJSON data overlays at any scale.

Place names are shown with more contrast at low zooms and less contrast at higher zooms to bring street names into focus.

Github is one of our first partners using the new custom vector tiles, something we are going to be rolling out to the larger public soon. Vector tiles make it possible for anyone to make a totally custom branded map – of the entire world – with no sacrifices in speed or device compatibility. For the cartographer, this means design iterations apply to a full global vector tileset in a matter of seconds – with no lengthy downloads, imports, or complex database queries. Watch AJ design a map in the new TileMill 2, our new design studio specifically built for vector tiles, to see how fast this can be.

Native GeoJSON Rendering

Point features with custom marker symbols

Many individuals, business, and government agencies are using GitHub to store open data, documentation, and tools to work with open data. Statistics Finland uses GitHub to provide tools for easier access to their open data API. The United States Governments’ Open Data Policy is itself hosted on GitHub, enabling Pull Request-inspired policy changes.

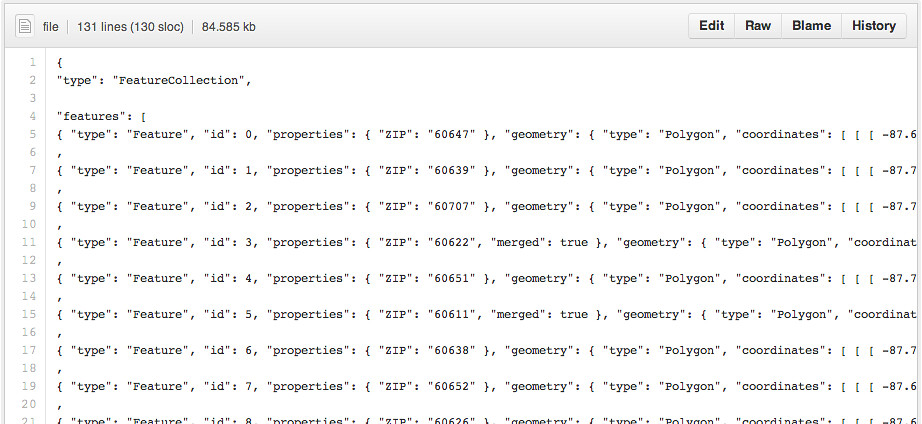
The new data visualization features added to GitHub repos have exciting implications for open data hosted on GitHub. Take, for example, SmartChicago’s zip codes dataset– previously displayed as raw GeoJSON on GitHub.

Chicago zip codes GeoJSON preview, before

Chicago Zip Codes GeoJSON preview, after

Your new visualization will even include interactivity. Feature properties are added to the feature’s popup window, enabling visitors to fully interact with and explore the dataset.

Sample showing complex polygon-rendering capabilities. DC Buildings database as a GeoJSON Preview on GitHub

Make Your Map

Maps on GitHub.com support rendering EPSG:4326 projected geometry types in the GeoJSON spec, including Point, LineString, Polygon, MultiPoint, MultiLineString, MultiPolygon, and GeometryCollection. To test out the new feature on GitHub, it’s as simple as committing a GeoJSON file to a repository.

For point geometry types, GitHub leverages our static Markers API to offer additional customization options to users.

  • marker-size: one of small, medium or large
  • marker-color: a valid RGB hex color, like #ff4444
  • marker-symbol: an icon ID from the Maki project or a single alphanumeric character (a-z or 0-9)

Simply add any of these attributes to the GeoJSON feature’s properties to customize the way the point is displayed on the map.

Custom Marker Colors

For more information on the functionality, check out GitHub’s docs for visualizing GeoJSON data.

Putting Landsat 8’s Bands to Work

$
0
0

Here’s picture of LA, just like an ordinary digital camera would take (if it had ten times as many megapixels and were in space). The image is only two weeks old, taken from Landsat 8, launched by NASA late this winter. Landsat 8 is already one of our favorite data sources – and not just ours: at State of the Map last weekend, it kept coming up in conversation with people from all kinds of backgrounds. More than just adding fresh true-color imagery from Landsat 8 to MapBox Satellite, we’re investing in data services using the multispectral information that the satellite provides. Its non-visual bands let us analyze everything from terrain types to crop growth to natural disasters – all around the world, sometimes within hours. This post introduces some of Landsat 8’s features, to give you a feel for what the world looks like through its lens.

Landsat 8 view of the Los Angeles area, May 13th, 2013. The image is rotated so north is up. All image data courtesy of the U.S. Geological Survey.

In Landsat 8 terminology, this is a band 4-3-2 image. A band is any range of frequencies along the electromagnetic spectrum – a color, although not necessarily a color visible to the human eye. Landsat numbers its red, green, and blue sensors as 4, 3, and 2, so when we combine them we get a true-color image like this one. But have a look at the full list of Landsat 8’s bands:

Of its 11 bands, only those in the very shortest wavelengths (bands 1–4 and 8) sense visible light – all the others are in parts of the spectrum that we can’t see. The true-color view from Landsat is less than half of what it sees. To understand the value of all the bands, let’s look at them each in turn:

The Bands

Band 1 senses deep blues and violets. Blue light is hard to collect from space because it’s scattered easily by tiny bits of dust and water in the air, and even by air molecules themselves. This is one reason why very distant things (like mountains on the horizon) appear blueish, and why the sky is blue. Just as we see a lot of hazy blue when we look up at space on a sunny day, Landsat 8 sees the sky below it when it looks down at us through the same air. That part of the spectrum is hard to collect with enough sensitivity to be useful, and Band 1 is the only instrument of its kind producing open data at this resolution – one of many things that make this satellite special. It’s also called the coastal/aerosol band, after its two main uses: imaging shallow water, and tracking fine particles like dust and smoke. By itself, its output looks a lot like Band 2 (normal blue)’s, but if we contrast them and highlight areas with more deep blue, we can see differences:

Band 1 minus Band 2. The ocean and living plants reflect more deep blue-violet hues. Most plants produce surface wax (for example, the frosty coating on fresh plums) as they grow, to reflect harmful ultraviolet light away.

Bands 2, 3, and 4 we’ve seen: they’re visible blue, green, and red. But while we’re revisiting them, let’s take a reference section of Los Angeles, with a range of different land uses, to compare against other bands:

Part of the western LA area, from agricultural land near Oxnard in the west to Hollywood and downtown in the east. Like most urban areas, the colors of the city average out to light gray at this scale.

Band 5 measures the near infrared, or NIR. This part of the spectrum is especially important for ecology because healthy plants reflect it – the water in their leaves scatters the wavelengths back into the sky. By comparing it with other bands, we get indexes like NDVI, which let us measure plant health more precisely than if we only looked at visible greenness.

The bright features are parks and other heavily irrigrated vegetation. The point near the bottom of this view on the west is Malibu, so it’s a safe bet that the little bright spot in the hills near it is a golf course. On the west edge is the dark scar of a large fire, which was only a slight discoloration in the true-color image.

Bands 6 and 7 cover different slices of the shortwave infrared, or SWIR. They are particularly useful for telling wet earth from dry earth, and for geology: rocks and soils that look similar in other bands often have strong contrasts in SWIR. Let’s make a false-color image by using SWIR as red, NIR as green, and deep blue as blue (technically, a 7-5-1 image):

The fire scar is now impossible to miss – reflecting strongly in Band 7 and hardly at all in the others, making it red. Previously subtle details of vegetation also become clear. It seems that plants in the canyons north of Malibu are more lush than those on the ridges, which is typical of climates where water is the main constraint on growth. We also see vegetation patterns within LA – some neighborhoods have more foliage (parks, sidewalk trees, lawns) than others.

Band 8 is the panchromatic – or just pan – band. It works just like black and white film: instead of collecting visibile colors separately, it combines them into one channel. Because this sensor can see more light at once, it’s the sharpest of all the bands, with a resolution of 15 meters (50 feet). Let’s zoom in on Malibu at 1:1 scale in the pan band:

And in true color, stretched to cover the same area:

The color version looks out of focus because those sensors can’t see details of this size. But if we combine the color information that they provide with the detail from the pan band – a process called pan sharpening – we get something that’s both colorful and crisp:

Pansharpened Malibu, 15 m (50 ft) per pixel. Notice the wave texture in the water.

Band 9 shows the least, yet it’s one of the most interesting features of Landsat 8. It covers a very thin slice of wavelengths: only 1370 ± 10 nanometers. Few space-based instruments collect this part of the spectrum, because the atmosphere absorbs almost all of it. Landsat 8 turns this into an advantage. Precisely because the ground is barely visible in this band, anything that appears clearly in it must be reflecting very brightly and/or be above most of the atmosphere. Here’s Band 9 for this scene:

Band 9 is just for clouds! Here it’s picking up fluffy cumulus clouds, but it’s designed especially for cirrus clouds – high, wispy “horsetails”. Cirrus are a real headache for satellite imaging because their soft edges make them hard to spot, and an image taken through them can contain measurements that are off by a few percent without any obvious explanation. Band 9 makes them easy to account for.

Bands 10 and 11 are in the thermal infrared, or TIR – they see heat. Instead of measuring the temperature of the air, like weather stations do, they report on the ground itself, which is often much hotter. A study a few years ago found some desert surface temperatures higher than 70 °C (159 °F) – hot enough to fry an egg. Luckily, LA is relatively temperate in this scene:

Notice that the very dark (cold) spots match the clouds in Band 9. After them, irrigated vegetation is coolest, followed by open water and natural vegetation. The burn scar near Malibu, which is covered in charcoal and dry, dead foliage, has a very high surface temperature. Within the city, parks are generally coolest and industrial neighborhoods are warmest. There is no clear urban heat island in this scene – an effect that these TIR bands will be particularly useful for studying.

Let’s make another false-color image by using this TIR band for red, a SWIR band for green, and the natural green band for blue (a 10-7-3 image):

Urban areas and some kinds of soil are pink. In the true-color image, wild vegetation is almost uniformly olive-colored, but here we see a distinction between peach-colored scrubland, mahogany-colored woodland, and so on. Cooling onshore breezes appear as a slight purple gradient along the coast of the city. The colored strips on either side of the image are areas where not all sensors have coverage.

More to Come

Everything we’ve seen here is from a single one of the 25,000+ scenes already in the NASA/USGS Landsat 8 archives – each one indexed, documented, and free to use for any purpose. Every day, another 400 gigabytes of imagery arrive. The potential of this open, ever-growing dataset is huge, and I hope you’ve seen something here that encourages you to use Landsat 8 data yourself.

Follow @MapBox on Twitter for a followup post on techniques, where we’ll cover how to use open-source tools to select, download, and process Landsat 8 scenes from concept to final product. As always, hit up Chris (@hrwgc) or myself (@vruba) with any specific questions.

The iD Map Editor is Translated Into Thirty Languages

Hacking the Red Planet in San Francisco

$
0
0

I'm headed to San Francisco, CA, this week to join other developers, designers, scientists, educators, and even astronauts at the Teaching Mars Hackathon.

Where Curiosity May Roam, NASA/JPL/University of Arizona

Jointly organized by Mozilla, KQED, and Bay Area digital media studios MX & Spine Films -- this open house hackathon will explore Mars-colonization and education themes, with an emphasis on open source tools.

"The red planet is the next frontier in human imagination."

As a developer who is fascinated by Mars and passionate about open source, I'm excited to take part in the hackathon. Who knows what apps, or maps, will come out of the hackathon -- perhaps a Mars version of MapBox Earth?

MapBox Mars iOS App Mockup

Hit me up on twitter (@hrwgc) if you want to chat about maps or Mars during the week.

Processing Landsat 8 Using Open-Source Tools

$
0
0

This step-by-step post walks through processing Landsat 8 imagery into an interactive map that you can integrate into your website or app. We’ll cover the process from finding and downloading the image data, through processing it and adjusting its color balance, to bringing it into TileMill and exporting it as an interactive web map – where it can be combined with markers, animation, and other layers using MapBox.js. We’ll use open source tools throughout, and many of the techniques you’ll see will also apply to other satellite and aerial data, like Landsat 7, MODIS, and even commercial imagery.

Requirements

This tutorial assumes you’re comfortable with the Unix command line. Besides standard utilities like tar, we’ll use the current versions of:

  • GDAL, a low-level GIS toolkit

  • libgeotiff, to work with geotags (the tools used here are sometimes packaged as geotiff-bin)

  • ImageMagick, an image processing package

  • TileMill, our open-source mapmaking app

I’ll explain what’s going on in each step, so if you prefer other tools you’ll be able to translate the techniques.

Because we’re working with datasets in the gigabyte range, you’ll want to do this on a computer with plenty of RAM – probably at least 8 gigabytes or so. If you don’t have one handy, you’ll find plenty of attractively priced cloud processing options these days.

Getting a scene

Landsat 8 data is cut into scenes, which are near-square images covering about 170 × 185 km (105 × 115 mi). You can think of a scene as a single frame from a camera. (For a more detailed understanding of its imaging process, see NASA’s description.)

There are several ways to find scenes, including EarthExplorer, LandsatLook, and GLOVIS. I recommend this helpful guide to EarthExplorer from Robert Simmon, a data visualization expert at NASA’s wonderful Earth Observatory. The only note to add is that if you find a lot of cloudy scenes for your area of interest, you can use a cloud coverage filter in the Additional Criteria tab.

Suppose we’re interested in the area around the Panama Canal. Following Simmon’s guide, we’ve found that scene LC80120542013154LGN00 is the most recent image with the coverage we want. (Landsat follows a given path around the world once every 16 days, and each scene is at a particular row of that path. The Panama Canal is on path 12, at row 54. There’s overlap between rows on neighboring paths, increasing toward the poles.)

In the bundle

The Level 1 Product comes as a .tar.gz file of about 700 megabytes to a gigabyte. Given the high demand for Landsat 8 imagery and the low funding for distribution infrastructure, you might want to get coffee while it downloads. (Note to Unix experts in a hurry: if you get the URL of the file, curl $URL | tar xfvz - will work.) The compressed file will unpack into a directory of 13 items, mostly TIFF images, each with an unwieldy-looking name starting with the 21-digit scene ID. This is the bundle. Here’s what you need to know about the bundle:

  • The images with names ending in digits are the data for those bands. For example, LC80120542013154LGN00_B9.TIF is Band 9’s readout.

  • The data is Level 1 terrain corrected, meaning that it’s been filtered to account for some sensor variations and for distortions caused by hills and valleys. The correction is not perfect, for example because the elevation dataset that it’s referenced against is a little coarse, but L1T is a good starting point for most uses.

  • Each image is aligned with the others, so you know that a given pixel at x, y in one band’s data represents exactly the same point in space as the corresponding pixel in another image in the same bundle. The exception is Band 8, the pan band, which is at twice the linear resolution. (The alignment does not carry between different bundles that share path/row numbers. They can vary by 10 km or so.)

These properties tell us enough to dive right into creating images.

First draft true color

Recalling from last week’s Landsat 8 post that the red, green, and blue bands are the ones numbered 4, 3, and 2, let’s make reprojected versions of each one:

for BAND in {4,3,2}; do
  gdalwarp -t_srs EPSG:3857 LC80120542013154LGN00_B$BAND.TIF $BAND-projected.tif;
done

And merge them into an RGB image with convert:

convert -combine {4,3,2}-projected.tif RGB.tif

Incidentally, don’t worry when convert prints about a dozen warnings like this one:

convert: Unknown field with tag 33550 (0x830e) encountered. 
`TIFFReadDirectory' @ warning/tiff.c/TIFFWarnings/824.

ImageMagick is not geo-aware, and this is what it reports as it sees, and does not copy, geo fields. We’ll re-attach the geodata later.

Let’s have a look:

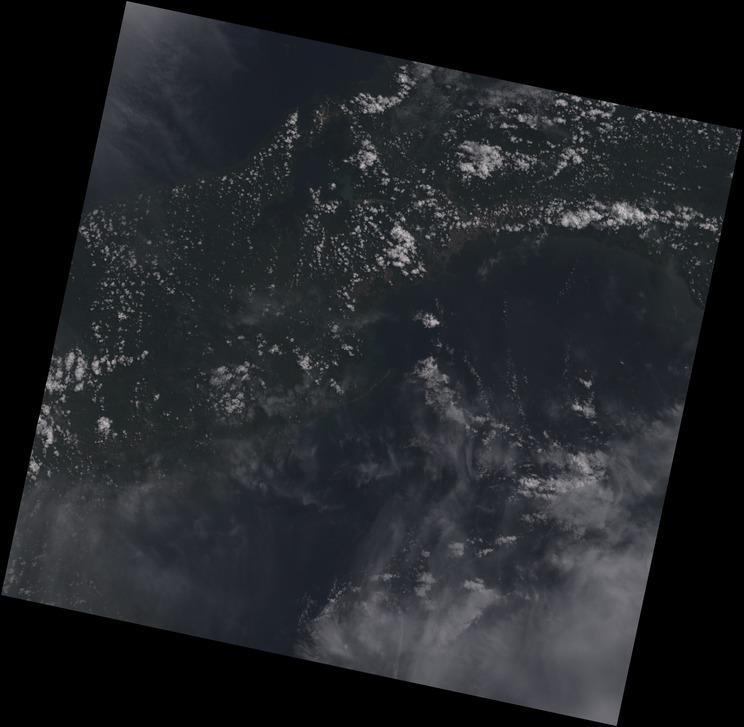
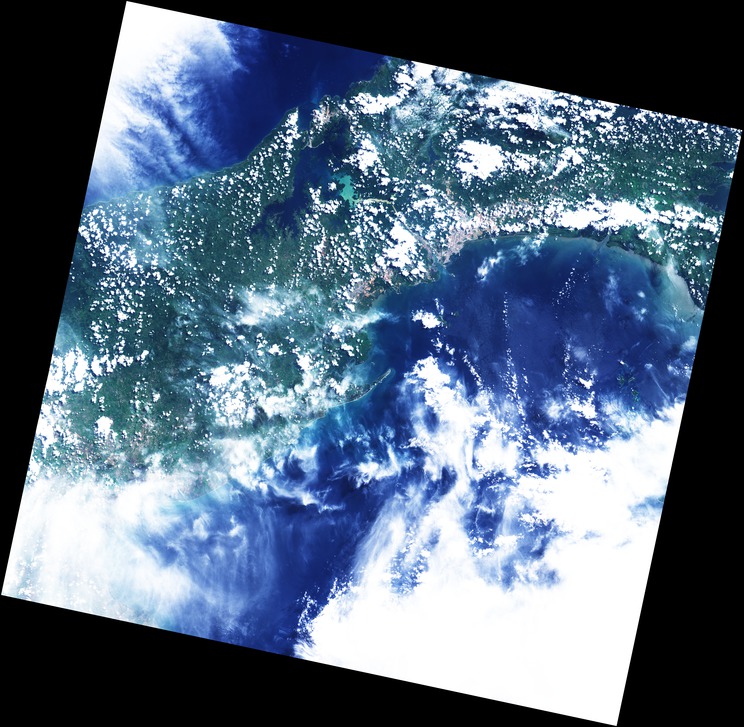
Ugh, how awful. The problem is that Landsat 8 is designed to survey the entire Earth, and a few parts of the earth are extremely bright, like Greenland and Salar de Uyuni. For the sensors to report useful values from those places as well as from dark areas like lakes and thick jungles, they need a huge range of sensitivity. (Digital photography buffs might recognize Landsat 8 as an HDR camera.) Therefore, even things that are bright in our everyday frame of reference can be dark in Landsat 8 L1T.

Truer color

To get something that looks like land looks, we need to increase both brightness and contrast. My favorite method is the -sigmoidal-contrast flag for convert, which takes a two-part argument: a scale factor for the contrast, plus the brightness value in the input image that should end up at 50% (midtone) in the output image. When we run this:

convert -sigmoidal-contrast 50x16% RGB.tif RGB-corrected.tif

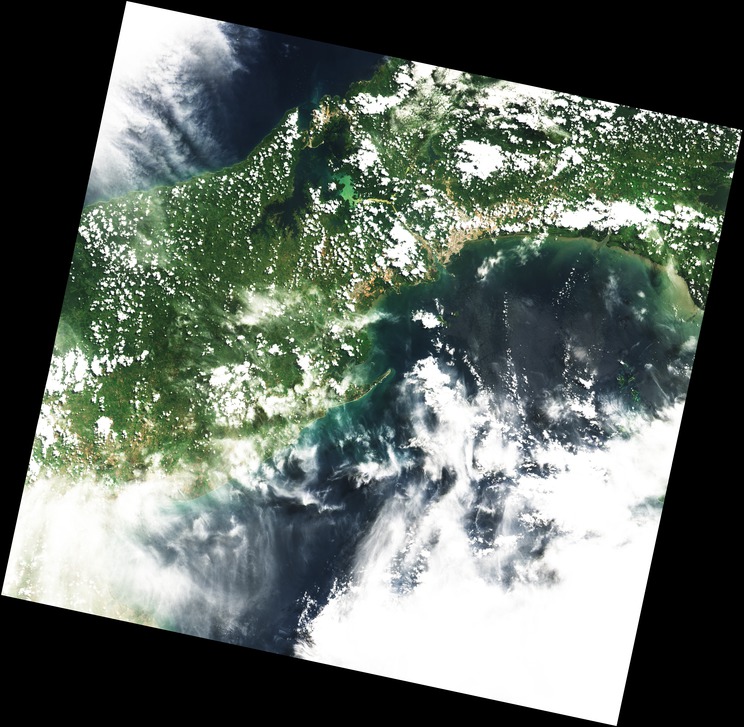
The output looks much better:

I used trial and error to find that the midtones in the input were at about 16% brightness in this image. If you want more consistent results, look in the file with the name ending MTL.txt, where you’ll find detailed records of optical attributes like sun angle, calibrated band radiances, and so on. If you’re doing further analysis, you’ll also get a lot of use out of the quality assurance pseudo-band, BQA.TIF, a bitfield in a format described here that helps find clouds, snow, missing data, etc.

There are textbooks the size of twins’ birthday cakes on the topic of satellite image correction, but today we’ll keep it simple. We’ll account for haze by lowering the blue channel’s gamma (brightness) slightly, and raising the red channel’s even less, before increasing the contrast:

convert -channel B -gamma 0.925 -channel R -gamma 1.03 \
-channel RGB -sigmoidal-contrast 50x16% RGB.tif RGB-corrected.tif

This gives us something that’s green where it should be green:

Like brightness and contrast, haze varies a lot between scenes, so take the numbers here as starting points for experimentation. If you want to turn the brightness way up to see lake surfaces better, or way down to see cloud structure, or run an edge detection filter to spot faint roadways, you can have at it. As long as you don’t change the dimensions of the image or introduce any spatial distortions, you can edit it from scratch however you please – with the full power of ImageMagick, with free or commerical graphical image editors, or with your own code – and you’ll still be able to re-attach the georeferences later.

False color (optional)

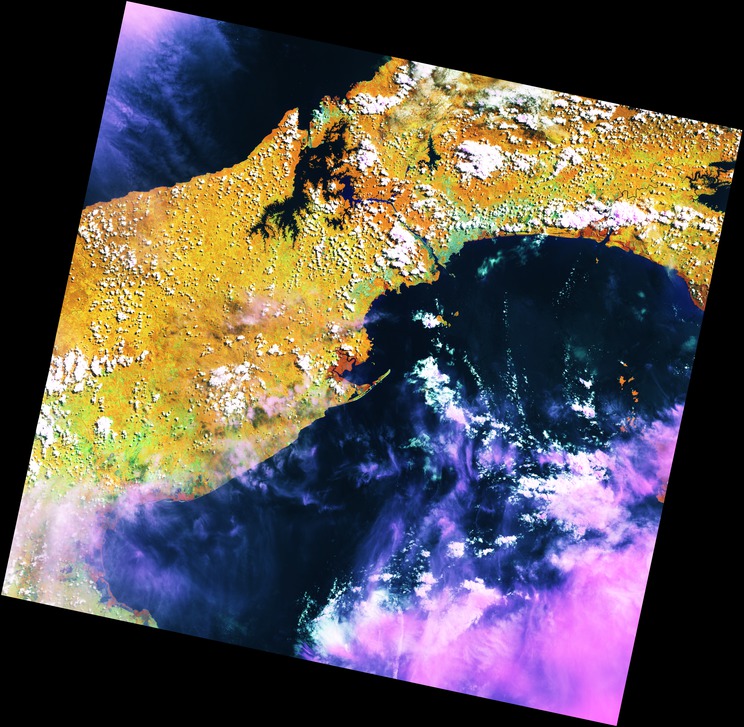
A true-color image is only one of the 165 distinct 3-band combinations that we can make from a single bundle, and not always the most informative one. If we’re interested in forest management and the water cycle, for example, we might want to look at the combination of NIR, SWIR, and visible red, using bands 5, 6, and 4 (similar to a 4-5-3 image from Landsat 5 or 7, for any old-timers in the audience). You can follow the same steps as you would for a 4-3-2 image, substituting the band numbers, then apply adjustments like these:

convert -channel B -gamma 1.25 -channel G -gamma 1.25 \
    -channel RGB -sigmoidal-contrast 25x25% 564.tif 564-adj.tif

Those will bring out some contrast in the scene:

Now we can make general observations on topics like where there are mangrove swamps (brick-red areas), which we couldn’t see clearly in the true-color image.

A note of caution: all satellite images are somewhat processed by the time we see them. For false-color images in particular, there’s often a lot of adjustment to normalize the different bands. When doing anything important, it’s vital to understand exactly what you’re looking at, and only compare like with like. This image might give useful insights on certain topics, for example, but it would be a big mistake to compare it directly with an old Landsat 5 image using a similar band combination and assume that any apparent changes were real – unless you could be sure that they’d gone through exactly equivalent processing.

As well as direct combinations, at this stage you can apply cross-band transformations like NDVI, EVI, or tasseled cap. Anything that doesn’t change the spatial layout of the image will work.

Pansharpening

Here, we could adapt Chris’s post from a few months ago on pansharpening with the Orfeo toolbox, or use any of the dozens of other standard methods. And stay tuned to this blog for a post on speed-oriented Landsat 8 pansharpening techniques in the coming weeks. The next directions, however, will assume we’re using only the 30 meter RGB channels without bringing in the pan band.

Re-applying geodata

The processed image is a 16-bit TIFF without geodata, but we’d like an 8-bit TIFF with geodata. Changing the bit depth works like this:

convert -depth 8 RGB-corrected.tif RGB-corrected-8bit.tif

Since we were careful not to make any modifications that affected the spatial characteristics of the data (right?), we can copy the geographical information back from one of the projected but not manipulated bands. listgeo works well for this:

listgeo -tfw 4-projected.tif

It writes the geodata to a file with the same basename but the suffix .tfw (“TIFF worldfile”), which we’ll rename to match the file that we’re re-georeferencing:

mv 4-projected.tfw RGB-corrected-8bit.tfw

GDAL knows to look for a matching .tfw if it sees a TIFF that isn’t internally georeferenced, and while we’re at it will give the image a name that will be less confusing if it’s combined with other map elements:

gdal_edit.py -a_srs EPSG:3857 RGB-corrected-8bit.tif
mv RGB-corrected-8bit.tif Panama-projected.tif

Importing to TileMill

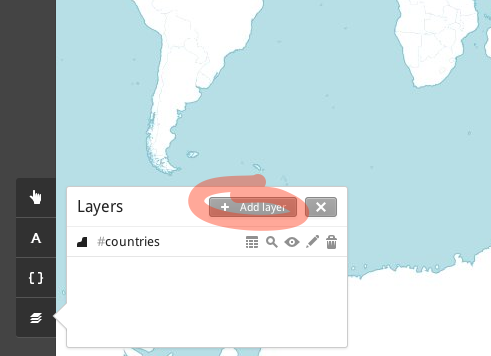
In a TileMill project, we add a layer via the menu at the bottom left:

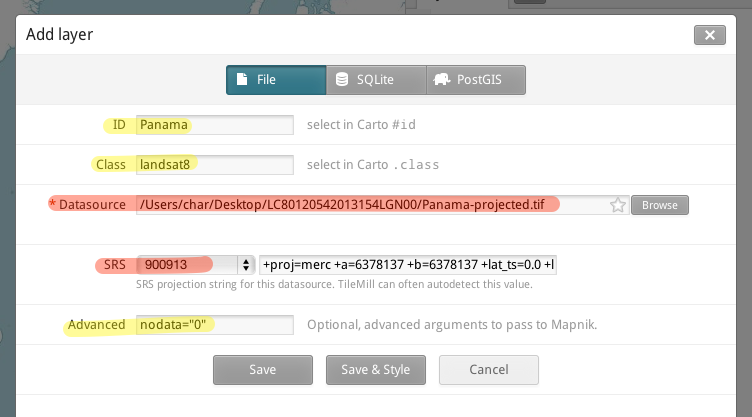
And tell TileMill how to treat the image:

All TileMill really needs to know is where to find the image and what SRS to use. But giving it a useful ID and class makes it easier to work with as projects grow, and nodata="0" will make the black edges of the image transparent:

Now we have all the tools of TileMill at our disposal. We can turn to Chris’s recent post on raster analysis to get some ideas for handling color, for example, or look in the documentation for guides to markers, interactivity, and so on. You might be pulling in this image as one small part of a very complex project – but let’s keep this demo bare-bones and just set the raster-scaling method to lanczos, to help prevent jaggies.

Exporting from TileMill

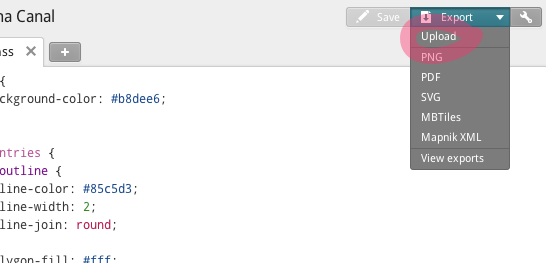
Once we’ve done everything we want in TileMill, we can use the Export menu in the upper right. We’ll upload to the MapBox account associated with TileMill (which can be changed in the Preferences screen):

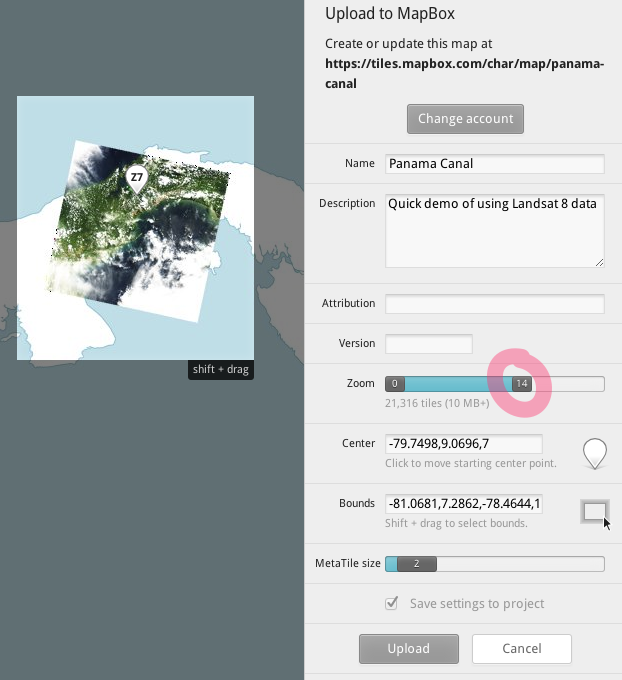
In the upload screen, we draw some reasonable boundaries and pick a center point. To save rendering time, let’s set the maximum resolution to zoom level 14, since that’s just beyond the maximum clarity that Landsat 8 could yield, even with pansharpening:

Once the tiles have rendered and uploaded, we have a browsable map hosted on MapBox:

Conclusions

We’ve downloaded Landsat 8 data, color-corrected it, pulled it into TileMill for use with other map resources, and uploaded it as a live map layer on MapBox. I hope this has encouraged you to make use of Landsat 8 data – and given you a head start on working with imagery from other sources.

As always, you can bring questions and comments to Chris (@hrwgc) or me (@vruba) on Twitter, and follow @MapBox for more updates, tutorials, and cool pictures.

Viewing all 2230 articles
Browse latest View live