Quantcast
Channel: maps for developers - Medium
Viewing all 2230 articles
Browse latest View live

Publish drone imagery on Mapbox directly from Pix4D

$
0
0

Today the drone imagery processing software Pix4D rolled out full integration with Mapbox, making it possible to upload imagery from Pix4DMapper to Mapbox.com in one step. Collect your aerial imagery with the flying platform of your choice, process images locally with Pix4D, and upload to Mapbox directly from within Pix4D. Once your imagery is on Mapbox, you can layer it with Mapbox Streets and Mapbox Satellite to provide context and use the Mapbox APIs to integrate the imagery into your applications.

Push your imagery into the Mapbox cloud directly from Pix4d.

All Pix4d users will have access to a free Mapbox account and Pix4D has reached out to all customers with the information you need to use Mapbox for free. If you have any questions, please send an e-mail to support@pix4d.com.

Hit me up on Twitter with any questions about the new feature or our preferred setup for making beautiful imagery maps with drones.


Drone Mapping for Urban Planning in Mexico City

$
0
0

Last week at ConDatos in Mexico City we joined forces with Laboratorio para la Ciudad and the Mexican Presidency to fly drone mapping missions over the city. Both groups are working to bring innovation to government at an urban and national level, respectively.

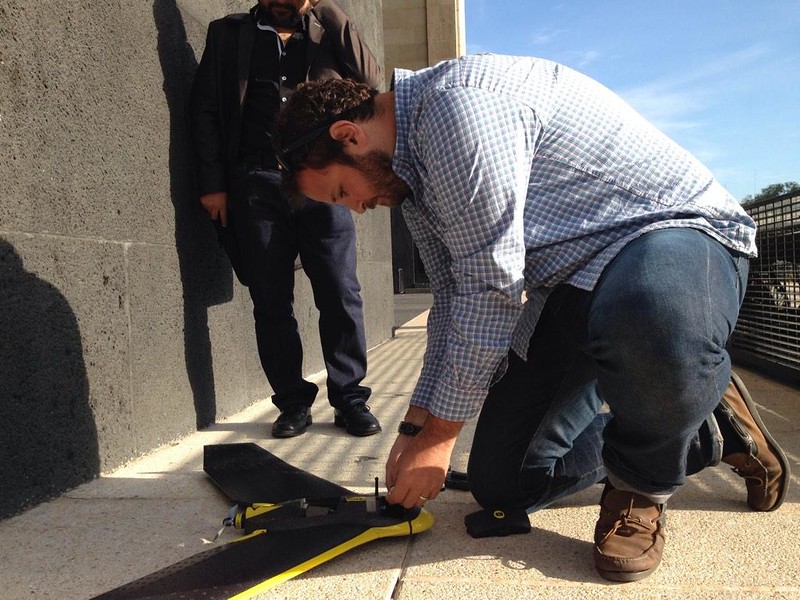
The Laboratorio para la Ciudad uses media and technology to revitalize neighborhoods and strengthen communities within the city. On Thursday we flew a light fixed-wing mapping drone near Mexico City’s Monumento de la Revolución as a demonstration of how UAVs can support urban planning and development. In eight minutes we captured an area of 0.2 square kilometers at a resolution of 4.5 cm.

Preparing the UAV for launch. Photo courtesy of @labplc.

After flying we processed the imagery in Pix4D and uploaded it to Mapbox.com, where it is now available for the Laboratorio’s use.

Imagery we captured with a Sensefly eBee at Monumento de la Revolución in Mexico City. All imagery hosted on Mapbox.com. This imagery is available for any use. Street data: OpenStreetMap.

Ping me on Twitter if you want to talk about making maps with drones.

Introducing the Surface API

$
0
0

Introducing the Mapbox
Surface API

Introducing the Mapbox Surface API

Introducing the Mapbox Surface API: it’s a remarkable new way to access raw data behind a map. Using Mapbox Vector Tiles, the Surface API can look at elevation profiles to crime indices to home prices – anything, any data that you upload. Now it’s as easy to make a geo API as it is to make a map.

The core of the API is a flexible query interface. Given a point on a mountain, it can compute the elevation at that point by interpolating nearby values. Given a line across the mountain’s ridge, it’ll return multiple elevation values along the path. And with the power of custom data, it can do so much more.

The API comes with the Mapbox elevation dataset, but the real power is being totally customizable: with custom vector tiles from Mapbox Studio, you can make a totally new kind of geographical API. Create datasources for prices, temperatures, precipitation, sound, radiation, walkability - anything that’s geographical - and the Surface API will query and analyze it. Here’s an example from Death Valley, California, where we compare weather and elevation. Click the map in two places to give it a try:

Comparing weather and elevation with the Surface API.

We also made a bicycle theft rate density map in San Francisco that features bike theft and elevation. We uploaded theft data from data.sfgov.org to Mapbox so that we could visualize theft rates as we plan rides around the city. Click the map in two places to plan a route:

Routing with bicycle theft data and elevation in San Francisco.

Private Beta

Starting today, the Surface API is available in private beta. If you’re interested in using it, read the documentation and fill out the form below. If you’re wondering how to build Surface API queries, check out our query builder tool to see how queries can be made using any mapid

If you make something cool, ping us @Mapbox.

Surface API request form


43,000 km of 10cm imagery added for Denmark

$
0
0

We just added 43,000 km of brand new 10cm orthoimagery, covering all of Denmark, to Mapbox Satellite. We sourced the imagery from the Danish Geodata Agency and rolled out updates across the country of Denmark.

43,000 km2 of 10cm imagery added for Denmark

<p>We just added 43,000 km<sup>2</sup> of brand new
    10cm orthoimagery to Mapbox Satellite. We sourced the imagery from the <a href="http://www.gst.dk/">Danish
    Geodata Agency</a> and rolled out updates across the country of Denmark. Part of the Danish government's <a href="http://www.digst.dk/Servicemenu/English/Policy-and-Strategy/eGOV-strategy">eGovernment strategy 2011-2015</a>, the imagery is released <a href="https://www.mapbox.com/blog/trouble-with-geoportals/">openly and
    accessibly</a> via Denmark's basic data program.</p><p><img alt="" src="https://farm3.staticflickr.com/2950/15285033538_32158c9357_b.jpg"></p><p><em class='quiet small'><a href="http://en.wikipedia.org/wiki/Kastellet,_Copenhagen">Kastellet</a>,
    in Copenhagen, is a classic star fortress, designed so that any
    attacker approaching one wall could be fired upon from at least one
    other wall. It included grassy areas in order to feed animals so it
    could last longer under siege. A <a href="http://www.copenhagenpictures.dk/kastel.html">Danish website</a>
    remarks that: "The fact that some of the cannons actually point toward
    Copenhagen itself is due to King Christian III's concept of how to rule
    a country."</em></p><p>With this imagery's 10 centimeter-per-pixel resolution, we can do much more than <a href="http://www.cnbc.com/id/38722872">count cars in parking lots</a>:</p><p><img alt="" src="https://farm4.staticflickr.com/3945/15285650800_6cffeee788_o.jpg"></p><p><em class='quiet small'><a href="http://en.wikipedia.org/wiki/Kultorvet">Kultorvet
    Square</a>, where the philosopher S&oslash;ren Kierkegaard lived as a student,
    was recently redesigned by the local architecture/design firm <a href="http://www.polyformarkitekter.dk/english/">Polyform</a>.</em><p><p><img alt="" src="https://farm3.staticflickr.com/2949/15472015942_c6228a6041_o.jpg"></p><p><em class='quiet small'>Zoomed all the way in, we can see not just cars but bicycles,
    and which café tables are occupied.</em></p><p><img alt="" src="https://farm6.staticflickr.com/5612/15473088705_5dbc792127_o.jpg"></p><p><em class='quiet small'> In this image, we see rooftop solar installations, trampolines, and one fish pond that would be easy to confuse with a trampoline at a lower resolution. The number of trampolines amazed us when we started rendering the imagery. In some neighborhoods, we counted a 40% household trampoline ownership rate. Denmark is truly a kind of paradise.</em></p><p>Today's rollout includes the most recently captured aerial
    photography available, with more than half of the imagery captured within the past year.</p><ul><li><strong>2014</strong>: Albertslund, Aller&oslash;d, Ballerup, Br&oslash;ndby, Drag&oslash;r, Egedal, Fredensborg, Frederiksberg, Frederikssund, Fures&oslash;, Gentofte, Gladsaxe, Glostrup, Gribskov, Halsn&aelig;s, Helsing&oslash;r, Herlev, Hiller&oslash;d, Hvidovre, H&oslash;je-Taastrup, H&oslash;rsholm, Ish&oslash;j, K&oslash;benhavns, Lyngby-Taarb&aelig;k, R&oslash;dovre, T&aring;rnby, Vallensb&aelig;k, udersdal, Faxe, Greve, Kalundborg, K&oslash;ge, N&aelig;stved, Odsherred, Roskilde, Solr&oslash;d, Sor&oslash;, Stevns</li><li><strong>2013</strong>: Hedensted, Herning, Holstebro, Horsens, Ikast-Brande, Lemvig, Ringk&oslash;bing-Skjern, Silkeborg, Struer, Assens, Faaborg-Midtfyn, Kerteminde, Langeland, Middelfart, Nordfyns, Nyborg, Odense, Svendborg, &AElig;r&oslash;, Bornholms, Guldborgsund, Holb&aelig;k, Lejre, Vordingborg</li><li><strong>2012</strong>: Br&oslash;nderslev, Frederikshavn, Hj&oslash;rring, Jammerbugt, L&aelig;s&oslash;, Mariagerfjord, Mors&oslash;, Rebild, Thisted, Vesthimmerlands, Aalborg, Skive, Viborg, S&oslash;nderborg, T&oslash;nder, Vejle, Aabenraa</li><li><strong>2011</strong>: Favrskov, Norddjurs, Odder, Randers, Sams&oslash;, Skanderborg, Syddjurs, &Aring;rhus, Billund, Esbjerg, Fan&oslash;, Fredericia, Haderslev, Kolding, Varde, Vejen</li></ul><p><img alt="" src="https://farm4.staticflickr.com/3939/15285033898_573349be62_h.jpg"></p><p><em class='quiet small'>The town of Svogerslev, a suburb of Roskilde. Wind turbines are
    scattered around the area. Denmark was an early adopter of wind power,
    which today supplies about 33% of grid power, and is on track to reach
    50% by 2020. On stormy days over the last year, Denmark produced more
    electricity from wind than the entire country consumes and sold surplus energy to Germany and Norway.</em></p><p><img alt="" src="https://farm6.staticflickr.com/5615/15284776509_68f9dcbccd_b.jpg"></p><p><em class='quiet small'><a href="http://en.wikipedia.org/wiki/Middelgrundsfortet">Middelgrundsfortet</a>
    is a sea fort between Copenhagen, the capital of Denmark, and Malm&ouml;,
    a Swedish city across the &Oslash;resund strait. The strait has been
    strategically vital from early Viking history to WWII, when Danish Jews
    were smuggled across it to Sweden. From 1429 to 1857, it cost money to
    pass through – the <a href="https://en.wikipedia.org/wiki/Sound_Dues">Sound Dues</a>. Middelgrundsfortet was built in the 1890s as part of Copenhagen's
    defense perimeter, and was only retired late in the Cold War, by which
    time it was an antiaircraft installation. <a href="http://www.vladi-private-islands.de">Valdi Private Islands</a> lists
    it at a <a href="http://www.vladi-private-islands.de/en/island+buy+middelgrunds-fort+denmark+europe-atlantic-ocean/">
    rumored price of about $20 million</a>.</em></p><p><img alt="" src="https://farm6.staticflickr.com/5600/15471249672_e81bbb9c6b_b.jpg"></p><p><em class='quiet small'><a href="http://en.wikipedia.org/wiki/Amalienborg">Amalienborg</a> is the
    winter residence of the Danish royal family. It consists of four
    semi-separated rococo palaces facing a plaza featuring a huge statue
    of King Frederick V on a horse, visible here in shadow.</em></p>
Querying Custom Data with the Surface API

$
0
0

The new Surface API allows you to create your own geographic query API from any data in minutes. Here’s how:

1. Find and download a dataset

Government data portals like San Francisco’s DataSF provide many geographic datasets for public consumption. One of the datasets available on DataSF is a high-resolution shapefile of elevation contours generated from LiDAR data. We’ll use this high-resolution dataset to create our own custom elevation API.

2. Upload to Mapbox.com

Upload the zipped shapefile directly to Mapbox.com and we’ll automatically convert it into Mapbox Vector Tiles which work with the Surface API, Mapbox Studio, and Mapbox GL.

3. Build a query

Build a query

Copy the Map ID of your upload and paste it into the Surface API query builder. This loads the data layers and their attributes, and allows you to build a query URL. Draw a line to query the data at a few points and see the response immediately.

Build a query

See the Surface API documentation for more details on modifying your query.

This is the basic process for an off-the-shelf dataset, and there are many more possibilities for building geo APIs from your own custom data. Find me on Twitter to talk about using custom data with the Surface API.

Fast updates to all our servers

$
0
0

We run hundreds of virtual servers on Amazon Web Services. So when security bugs like the bash vulnerabilities from a couple of weeks ago arise, we’re faced with a sudden, urgent need to perform a lot of updates.

These virtual servers are started from an Amazon Machine Image, or AMI, that has a basic operating system installed and usually not much else. When low-level vulnerabilities come up, Ubuntu is quick to provide a set of new, fixed AMIs, with a great website you can use to manually find what you need.

But how do we find the right updated AMI for the barrage of different ones being used across all our servers? The answer: write a Node.js module to do it for us!

Our open-source update-amis module uses the AWS EC2 API to look up information about an Ubuntu AMI and tell you the ID of the most up-to-date AMI sharing all the same qualities (operating system version, region, virtualization type, etc). Not only that, but given a file or just any old string of text, update-amis will hunt for anything that looks like an AMI ID, and find/replace it with the most up-to-date AMI available.

We document our servers' configurations in AWS Cloudformation templates. One of these files defines all the AWS resources needed to run and maintain one of our services. So now, when we need to update the servers backing one of our services we can just run the template through update-amis and deploy the fixed template!

Progress mapping West Africa's Ebola outbreak

$
0
0

For the past six months, 1,650 Humanitarian OpenStreetMap Team (HOT) volunteers from more than 100 countries have worked around the clock to produce detailed maps of areas affected by West Africa’s Ebola outbreak and get them into the hands of humanitarians.

Volunteers in Togo contributing to #map4ebola with help from Espace OSM Francophone (EOF). Photo courtesy of EOF.

West Africa is now HOT’s biggest-ever project, and the results are incredible. HOT volunteers have added more than 9 million objects to OpenStreetMap’s coverage of Sierra Leone, Liberia, and Guinea since March 2014, including 29,000 place names, 123,000 km of roads, and 774,000 buildings.

Here’s a visualization of all that mapping work:

HOT’s building data makes house-by-house contact tracing easier. And HOT’s detailed road and infrastructure maps help governments and aid organizations move supplies and patients efficiently.

If you want to help, HOT will walk you through the process. If you’re already familiar with OpenStreetMap editing, check out HOT’s task manager to see areas in urgent need of mapping.

Johan Uhle joins Mapbox

$
0
0

Johan Uhle has joined the Mapbox team! He is working on global Mapbox infrastructure, making sure that data is processed quickly and maps are delivered reliably and fast.

Johan lives in Berlin/Germany, where he studied Computer Science at the Hasso-Plattner-Institute. Previously he worked as Backend Engineer at SoundCloud. When he is not in cyberspace, he is probably out rock climbing. If you want to know more, check what Johan wrote about joining the team on his personal blog freenerd.de.


Querying elevation data from drones

$
0
0

We’re now able to query elevation data captured from drone flights. The example below uses terrain data recorded on a Sensefly eBee drone flight over a quarry near Lake Geneva. After processing the data with Pix4D, we know the elevation of every point in the area flown. With a little math we can calculate the total volume of gravel removed at the quarry.

Both the imagery and the elevation data captured during flight can be uploaded right to mapbox.com. Using Mapbox.js, I’m able to overlay the drone imagery on top of our satellite layer, build out a layer switcher to toggle contour lines, and query the vector data behind the map using the Surface API.

This drone demo app is live. Try it out by drawing a rectangle with the tool on the left side of the map and watch as the results return via the Surface API. Requests for elevation data made via the Surface API allow us to calculate the total volume of earth removed from the quarry.

To calculate volume, we first looked at a single elevation data request, which is represented as one horizontal line on the map. By making many of these small “slab” requests in a row, the total approximate volume can be calculated with a simple formula that I worked on with our rocket scientist, Bruno.

The Surface API launched this week in private beta, let me know if you want to check it out or hit me up on Twitter @bobws.

Privacy, Transparency, and Law Enforcement

$
0
0

We’re a mapping platform for our customers' services. We power Runkeeper’s new route planning app, DroneDeploy is building on our Upload API, and Pix4D uses us as their one-click publishing platform for drone imagery. As a platform for other platforms we are responsible for protecting the privacy of our customers and their users. We take protection of user data very seriously. In addition to continuously updating the transparency report that we launched in June 2013, we just rolled out a refreshed privacy policy and new law enforcement guidelines today.

We collect very little information about you by design, store that information carefully, and never share it unless legally compelled by law enforcement. We require a subpoena or court order to provide basic information like your full name and means of payment. And to disclose your content, including maps and data, we need to see a probable cause search warrant. Simple.

Huge thanks to Marcia Hofman, former senior staff at the Electronic Frontier Foundation, for doing a full review of our privacy policy, and to EFF attorney Nate Cardozo, who maintains EFF’s “Who Has Your Back” list. Mapbox is aiming for five of six stars – we can’t fights for users' privacy rights in courts until we’re served a subpoena ;).

While the language of our policies is very direct, it is not meant to be anti-government. We acknowledge that government sometimes must act to protect citizens' safety and security. When information requests follow the law, we will cooperate with law enforcement and listen to the courts. But our refreshed policies are part of a bigger Mapbox mission. We are explicit about privacy because we strongly believe that the laws regulating government surveillance of individuals and access to user information need to be reformed. Mapbox has signed the Stop Watching Us petition and supports the principles of the Reform Government Surveillance open letter to Congress.

Hit us up on Twitter @Mapbox or me personally @ericg if you want to talk about privacy or have questions about how we handle your data. A lot of folks on our team worked on this new policy: Matt Irwin (ping @mtirwin) ran point with EFF, Mike Morris explained how we can push for larger reform in government surveillance beyond protecting Mapbox and its users (ping @mmorri), Nick Ingalls (ping @nickingalls) built the warrant canary in our transparency report, and Jeff Miccolis, Ian Ward, and Will White have been beyond paranoid in ensuring we store as little user information as possible.

Making Ayacucho the best map in Latin America

$
0
0

These past weeks our data team took a break from improving OpenStreetMap all around the globe and focused on mapping beautiful Ayacucho, Peru, where many of us are based. Our goal: to give Ayacucho the best map on OpenStreetMap in Latin America. Of course, we are hoping for fierce competition :)

After we calibrated imagery with GPS control points, we updated all elements on the map to correct location discrepancies, added new data from satellite imagery and then went out to survey the city for street names, neighborhood names and major points of interest. This is an ongoing effort; here is an overview of our work so far.

Ayacucho on OpenStreetMap after our mapping efforts.

Mapped all streets

95% of all streets are named now. To gather street names and one ways, we surveyed with walking papers. Some places in Ayacucho don’t have street names, only block names; we also mapped those.

Richman surveying the streets of Ayacucho.

Added major points of interest

We added around 700 major points of interest like public entities, financial, educational institutions, restaurants, and more. Just like with street names, we gathered this information with ground surveys.

Points of interest gathered in Ayacucho.

Map details

Beyond streets and points of interest, we added as much detail to the map as possible. Using satellite imagery and local knowledge we mapped many trails, parks, rivers, traffic lights, bus stops and trees.

Map details in the north of Ayacucho.

Community

To coordinate efforts with other mappers in Ayacucho, we created a Facebook page. Our goal is to involve more people in Ayacucho to map their city on OpenStreetMap. We will soon be announcing the first Ayacucho geo meetup. Our goal is to build local community, recruit more mappers and bring OpenStreetMap as a viable mapping solution to NGOs, businesses and government. Finally, we are working on a proposal to import city building and address data to further improve our map. We are looking forward to working with everyone on the ground and from the international community to improve Ayacucho on OpenStreetMap. For any feedback, please get in touch on Twitter or on OpenStreetMap.

Progress made mapping Ayacucho in the past month.

Encuentra la versión español en mi diario de OpenStreetMap.

GeoJSON overlays for static maps

$
0
0

We’ve expanded the functionality of our static maps API to include support for overlaying paths and GeoJSON. Everyone has access and can start playing with the API today.

Preview GPX traces in your fitness app:

Highlight specific building lots:

Display a preview of a flight:

San Francisco to Paris, overlaying both GeoJSON and Mapbox markers

…or just improve our maps with a bit of artistic flair:

Web to Canvas Print: Resolution Independence with Mapbox Studio

$
0
0

Mapbox Studio’s print export tool makes it possible to create high-resolution prints of any map style. Naturally, we were first in line to try the feature out, printing the amazingly loud and colorful “Wheatpaste” map for our Mapbox DC Garage. It’s a default map style that comes with Studio, designed by Ian Villeda, who was inspired by posters, flyers, and, of course, wheatpaste.

Here’s how we did it.

High-Resolution Printing with Mapbox Studio

Step 1. Design

If your map uses background images, make sure that they are high quality. Use .png or .svg files to ensure that they will scale up well for printing. Do a few test prints by downloading samples and printing them off to see how they look. Check out this Foundations article for tips on styling polygons with patterns and texture images.

In CartoCSS, Ian used the land paper texture: background-image: url(img/land_paper.png); and the water paper texture: polygon-pattern-file: url(img/water_paper.png); to add land and water texture to his design.

texture

Ian styled the hillshades with the full_highlight.png, medium_highlight.png, full_shadow.png and medium_shadow.png files.

pattern

The test prints of the map looked good so I was ready to export the map.

Step 2. Export

To export the maximum quality image, set the image format to 24-bit .png in Studio’s Settings panel. Although .png files are meant for web, not print, they use lossless compression, unlike .jpeg files which use lossy compression. Lossless compression images render solid quality backgrounds, leaving no visible artifacts, and they convert well into CMYK.

image-format

Next, I opened the Export Image panel by clicking the image icon in the top right corner of Studio. I found that the final image was too large (96" x 59") to export in one piece. So I figured out the maximum size that I could export at my chosen zoom level of 13 and divided the image evenly into three image exports at 32" x 59" each.

To properly crop and export tileable images, I used Mapbox Studio to calculate my bounding box coordinates for each image section.

export-screen

I started with the middle section. As illustrated in the diagram below, I centered my crop over Washington, DC and then set my crop size to 32" wide and 59" high, marked here in red. That gave me both the center latitude and longitude points (38.9048, -77.0403) and the W, S, E, N coordinates for the center export, marked here in blue.

diagram

Since the left and right export sections have the same dimensions as the center section, I only needed to change the longitude values. The outer W, E values from the center section became the inner E, W values , respectively, for the left and right sections. Given the crop size, then, Mapbox Studio automatically determined the correct outer longitude values, marked in purple.

Remember to use the center button and make sure that your W, S, E, N values stay the same. These values will jump around a bit as you re-adjust the bounding box.

After you have prepared your exports, jot down your final coordinates and download each image section as a .png with 300 ppi resolution.

download

Step 3. Print

In Photoshop, or an image editor of your choice, reassemble the map. You will also need to change the image color mode from indexed color to RGB and change the resolution from 72 to 300 ppi.

image

300 dpi

Working closely with our printer, Printmoz.com, I added crop marks with a 3" bleed around all sides of the map to ensure a proper and accurate final print.

Map delivery

The final massive printed canvas arrived on a truck last week.

arrival

The map looks incredible on canvas. If you ever stop by the Mapbox Garage in DC, ask to visit the room with the “Wheatpaste” canvas map.

office

office closeup

More storage for publishing drone imagery on mapbox.com

$
0
0

We just increased the storage included with Mapbox accounts. Our free Starter plan now includes 100MB/month, our $5 Basic plan increased 4x to 1GB, the $50 Standard plan now comes with 5GB, our Plus plan increased from 10GB to 25GB, and we added an additional 20GB to Premium so that our high-end accounts have 50GB of data storage. All at no extra costs, it’s just part of the plans. We’re also now offering storage add-ons for all Premium plans: you can add 1TB of storage to your account for $100/month.

With higher storage levels, we’re making it easier to use drones to publish beautiful, high resolution imagery. We love drones, love what our friends at SenseFly are building, love creating maps from drone imagery with 3DRobotics, love how easy it is to publish imagery from Pix4D, just got back from using drones for urban planning in Mexico City, and see huge potential around the use of drone imagery for OpenStreetMap.

Have a question about publishing imagery? Ping me @pdgoodman on Twitter or e-mail sales@mapbox.com.

Mapping Gaza before and after a crisis

$
0
0

The Humanitarian OpenStreetMap Team (HOT) is mapping buildings and streets in the Gaza Strip using high-resolution satellite imagery taken just before the outbreak of the the June-August 2014 conflict between Israel and Palestinian militants. Over 2,000 Gazans– of which the UN estimates 70 percent were civilians66 Israeli soldiers, and 7 Israeli civilians were killed in the fighting. According to the UN, the conflict displaced a quarter of Gaza’s population and damaged or destroyed 100,000 homes.

Red dots show buildings added by HOT mappers in just one week

HOT’s maps will make damage assessments (PDF) more accurate and help allocate the $5.4 billion pledged toward reconstruction. But HOT’s work won’t just aid Gaza’s recovery from the 2014 conflict – it’s also proactive. The house-by-house data will provide humanitarians a baseline for assessing and responding to any future fighting.

HOT’s task manager divides big areas into smaller mapping tasks and lets experienced mappers verify data quality

If you want to help, create an OpenStreetMap account, follow Mapbox’s iD Editor tutorial, and head to HOT’s task manager to find an area in need of mapping.


Premium plans now include paywall maps

$
0
0

Mapbox Premium plans now include maps behind a paywall for up to 1,000 seats. It’s just included with every Premium account. Until recently, applications with maps behind a paywall required custom Enterprise pricing. Now it is much easier to get up and running with applications behind paywalls: just select the Premium plan, swipe a credit card, and go.

We don’t consider paid mobile applications on iOS or Android to be behind a paywall. I just updated our help docs on all the details. It’s pretty straightforward: a seat is equivalent to a user account on your web platform, or a single-user license in your desktop software application. If you have any questions, hit me up personally by asking for Ali when you e-mail help@mapbox.com.

Temporary Flight Restrictions mapped live on "Don't Fly Drones Here"

$
0
0

The FAA issues Temporary Flight Restrictions (TFRs) to restrict airspace around VIP movements, natural disasters, and other special or sensitive events. Since we released the Don’t Fly Drones Here map, we’ve had a number of conversations with our friends in the drone community about how we could improve the map. Today we’re rolling out an update that adds TFRs to the map as soon as they’re available from the FAA. Visit the interactive map to see the TFR layer.

TFROur updated Don’t Fly Drones Here map, with TFRs added as orange zones. Check out the slippy map.

To build this map we scrape TFR announcement data with Kimono, build a geoJSON file from the coordinates in the TFR’s XML pages, bake the geoJSON into vector tiles, and layer the tiles on the base map.

potusTFRs blanketed the Windy City due to the President’s movements.

Andreas Viglakis joins Mapbox

$
0
0

Andreas Viglakis is joining the Mapbox team! Trained as an architect and urban designer, Andreas is now jumping into the space where map design, data wrangling, and visual storytelling intersect. One of his most recent map styles made with Mapbox Studio and Mapbox Outdoors is “Winter Wonderland.” It’s full of amazing details, down to the shade and exact thickness of the contour lines. You can check out some of his stunning previous work here.

Namaste India!

Color picker comes to Mapbox Studio

Viewing all 2230 articles
Browse latest View live