Richman Pariona joins the Mapbox data team! Before Richman joined he was researching traffic patterns in his home town of Ayacucho, Peru and creating software solutions for small businesses. He is now joining our growing data team to improve OpenStreetMap systematically identifying issues, adding data and fixing errors in the map.
Richman Pariona joins Mapbox
Custom Imagery in Mongolia for the Asia Foundation
The hills around Ulaanbataar, Mongolia, are dotted with large, unplanned settlements known as ger districts. Mongolians from rural areas have moved to these communities, which are connected by an ever-expanding road network. The Asia Foundation is working with the City Municipality of Ulaanbataar to map these population centers so that the City can deliver vital services – water, solid waste management, electricity, public transportation, education, and healthcare – to these marginalized, underserved communities.
Colorful roofs and unpaved roads are visible in the valleys around Ulaanbataar.
We’ve worked with our friends at DigitalGlobe to deliver to The Asia Foundation’s Mapbox account more than 2,000 km2 of imagery captured in the past 90 days. The Asia Foundation and its partners will trace this imagery using open source mapping tools and add new data to OpenStreetMap. Fresh satellite imagery traced with open tools will power a new map of Ulaanbataar that has the potential to change the lives of Ulaanbataar’s residents.
If you want to support The Asia Foundation’s tracing efforts, you can add this URL to your OpenStreetMap editor as a custom background layer and start tracing today:
http://b.tiles.mapbox.com/v3/the-asia-foundation.ulaanbataar/{z}/{x}/{y}.png
The high resolution WorldView-2 imagery is vivid and detailed:
Urban areas are detailed, capturing the activity of a busy city.
The hills of the city are lined with ger districts.
Hit me up on Twitter or e-mail satellite@mapbox.com to talk about how custom imagery can support your work.
Raster imagery to Mapbox in one step
You can now add any GeoTIFF imagery from satellites, airplanes, and drones directly to your account on Mapbox.com. Just upload your GeoTIFF file (up to 260 MB) to your Mapbox Standard or above account and we’ll instantly tile the data into an interactive map. From there you can quickly share the map and integrate it into your application with our APIs.
The imagery can also be loaded directly into Mapbox Studio, where you can layer your image onto Mapbox Satellite, add labels from Mapbox Streets, annotate the imagery with marking points, and create your own high-end custom designs.
Here’s a quick walk through of how to add imagery to Mapbox.com:
Upload a GeoTIFF image, and Mapbox.com automatically detects the metadata of your file and provides a direct link to the tiled source.
A historical map uploaded to my Mapbox account via Mapbox.com.
We hope this opens up lots of new possibilities with raster data & Mapbox. Have fun, and if you have any questions, feel free to hit me up at @CarolBirgitta on Twitter.
Winter Wonderland
Summer is officially over and we’re ready to get outside in the upcoming season with a custom winter-themed map. Built on top of Mapbox Outdoors, we have made a few changes to help people as they head for the slopes.
Thickened lines and and bolder colors emphasize slopes, lifts, and trails. To increase the legibility of topographical features important to riders, such as mountain peaks, I developed a new snowy, winterized color palette for hillshade and land use features. Building data has also been subtly darkened to help articulate the relationship between the towns that lie at the base of many winter sports destinations.
The map retains all of the key features and functionality of Mapbox Outdoors, such as labeled contours and slope difficulties, and the global coverage allows the mapping of international destinations like Italy’s Cortina d'Ampezzo.
Mapbox Studio allows anyone to design custom maps, and we have open sourced this style on Github. Use the coupon TRYMAPBOXSTUDIO to sign up and play with this style - among many others - and create your own.
Circa News: On-brand in mobile
Circa News just hit 3.0, now with hot new maps! We loved working with the Circa team as they deployed across both Android and iOS platforms for a unified experience. Circa CEO and co-founder Matt Galligan emphasized the design flexibility with Studio, which they used to bring their typefaces and color palette to their map.
Check out our design and development tools to try out Studio for this level of custom design.
Aerial + drone + satellite imagery internship
We’re going to ingest billions of new pixels from aerial, drone, and satellite sources into Mapbox Satellite and other imagery-based products. We’re looking for creative coders with strong research and communication skills to join Mapbox’s tight-knit team of developers, engineers, designers, cartographers, and communicators – all of whom know scale and how to ship. Together, we’re working to build the mapping tools and platform to ensure the future of mapping is open.
San Francisco, CA, USGS High-Resolution Orthoimagery Program
As an imagery intern, you’ll be joining the satellite team in San Francisco, CA, as we continue to acquire and ingest hundreds of terabytes of new aerial and satellite imagery into our global imagery base map, Mapbox Satellite.
From day one, you’ll have access to the massive computing power of our image processing pipeline. You’ll gain experience in imagery processing using open source tools like GDAL, rasterio, and Mapbox Studio.
You’ll work closely with folks from across the company to identify and acquire new imagery sources across the world. Leveraging our earlier work with open government data, you’ll develop an acute awareness of the U.S. and global open data and proprietary data infrastructures as you engage stakeholders and national and local governments in the open and proprietary data spaces.
Qualities we’re looking for
- Strong web research skills.Finding data can be hard; you should be hungry for the challenge.
- Data-driven problem solver. Data work is messy, and sometimes the best approach is the one that ships. Flexibility is key.
- Hunger to code. You don’t need to be a coder but you’ll quickly be exposed to Python, Bash, nodejs, among other languages.
- Strong oral and written communicator. You’ll be playing a key role in international data outreach and engagement with potential partners. We’re looking for someone who can be both persuasive and articulate across international and linguistic lines.
- Passionate about open. The power of beautiful open data has played a key role in Mapbox Satellite from its onset, and we continue to see immense value from sourcing both proprietary and open data to this day.
- Self-taught learner. You’ll be surrounded by teammates with deep experience in strategy, data, code, design, but we expect to be learning just as much from you.
- Excited to work in San Francisco, CA, or Washington, DC. Trolling is more fun when you can do it in person.
This position is a full-time, three-month internship, with the option to extend for longer. Our dog-friendly office is located in San Francisco, CA. There will be a competitive monthly stipend, frequent team lunches, competitive jenga matches, and office beer and/or bourbon.
To apply
Please send the following to jobs+satellite@mapbox.com
- Note describing why you’re interested in the imagery internship at Mapbox
- Resume
- Examples of previous work (maps, websites, articles, or whatever medium communicates your work best)
- (extra points) Design an awesome map with Mapbox Studio.
Deadline
The deadline to apply for the imagery internship is 5pm December 31, 2014.
New imagery of Mexico City for Condatos
We’re joining open data advocates from all over Latin America at Condatos next week in Mexico City. Check out the agenda for great talks and workshops. I’ll be leading a discussion on using drones for good (mapping!) on October 2.
We thought we’d get a little headstart on the event by rolling out 2,000 km2 of fresh DigitalGlobe imagery in and around Mexico City. As with all of the imagery available in Mapbox Satellite, this new imagery can be used for tracing in OpenStreetMap.
Take a look at a few highlights:
Vivero Coyocán, a National Park that also serves as a nursery for reforestation in Mexico City.
Mexico City’s iconic Bosque de Chapultepec.
Terminal Pantaco, a large industrial hub at the northern limit of the city.
Central de Abasto, Mexico city’s massive public market.
The Volcán La Caldera at the southeastern edge of Mexico City.
Designing a Pencil-drawn style in Mapbox Studio
Pencil is one of the 12 example styles included with Mapbox Studio, providing a hand-drawn pencil-on-paper look for a map of the whole world. The style is made up largely of image patterns, so most of the design work started on paper and was touched up in image editing software before finaly being arranged with CartoCSS.
My first step was to draw a bunch of lines with different pencils in order to get a variety of line widths and textures. As you can see I experimented with a few complex line styles that didn’t make it into the final design. I found that keeping line styles simple and focusing on only a few main feature types provided the best results in the end.
I scanned the lines and brought them into Gimp for editing. For most lines the main clean-up that I needed to do was resizing and straightening the lines to ensure they could be used seamlessly as patterns in Mapbox Studio. I also adjusted the contrast and used the handy Color to Alpha feature to remove the paper background and export images of just the pencil texture with proper transparency.
A different pattern image is needed for each of the different line widths that are used for different road types and zoom levels. In CartoCSS, rather than adjusting a width parameter as you would with normal lines, the entire image path is swapped out:
...
[class='motorway'] {
[zoom=13] { line-pattern-file:url(img/line_double_14.png); }
[zoom=14] { line-pattern-file:url(img/line_double_16.png); }
[zoom=15] { line-pattern-file:url(img/line_double_18.png); }
[zoom>15] { line-pattern-file:url(img/line_double_20.png); }
}
...
For double-lined roads, two patterns are needed to get the lines to join up correctly: one for the outlines and one for the inner line of the road, just as with road casing using normal lines in CartoCSS. The inner line, drawn on top of the outline, masks areas at intersections where multiple outlines would overlap and makes everything look nicely connected.
More complex polygon textures were arranged from multiple source images. This way I didn’t have to worry too much about how seamless textures would be while drawing them on paper. For example, here’s how 8 separate wavy lines were aligned and merged over a background texture to create the repeating water pattern:
The original hand-drawn lines were all slightly crooked, but here they have been individually rotated and aligned to a grid.
At lower zoom levels, line patterns do not work as well for all layers due to the many short line segments that roads and boundaries are split up into. At these scales the style uses multiple semitransparent line style instances with dasharrays in order to mimic a the slightly rough look of thin pencil lines.
...
a/line-width:0.6;
a/line-opacity:0.2;
a/line-dasharray:2,1;
b/line-width:0.8;
b/line-opacity:0.2;
b/line-dasharray:12,1;
...
For the final map, all the pencil textures are brought together over a paper-textured background image. You can explore any part of the world using this style, and since it’s included with Mapbox Studio you can also customize the design with your own textures and colors.
Katy DeCorah joins Mapbox
Katy DeCorah is joining the Mapbox team! Katy will be jumping into coding and design. I’m excited to be working with Katy to improve our tools and communicate with you about all the cool things you can do with them.
Katy is coming from design and usability work in state government and also teaches interaction design at the University at Albany. When there’s time left at the end of the day, she builds some very fun CSS experiments.
Audience-focused documentation
We’re doing a documentation push and now let you self-identify what kind of docs and notifications you get when you sign up. If you already have an account and want to fill out the form, there’s a secret method: just browse to mapbox.com/projects/#new and you should see the form!
Emoji Map Markers
It’s my first week at Mapbox. As I’ve been exploring Mapbox.js and trying to learn what’s possible, I wondered about map markers. I couldn’t help but think about , , , and . And sure, the more practical , , , and .
Emojis as map markers? I had to give it a try.
I didn’t know how one acquires the emoji trove, so I searched around Github. Sure enough, I found Github’s Emoji Showcase. I sifted through until emojify.js caught my attention.
Emojify.js will convert an emoji keyword to the image. That means I can type :rocket:
and the script will replace that keyword with the image . All the emojis are saved as data URIs, so I don’t need to worry about lugging around hundreds of images. All I need is emojify.js and emojify.css hooked up on my page, and a little JavaScript to get everything working.
Armed with hundreds of emojis, my next step was to swap markers with emoji keywords. After a few clicks around Mapbox.js documentation, I landed on divIcon. divIcon
is the sweet spot for fully customized markers. It allows you to replace the traditional marker with a div
. You can add a class to that div
or, more importantly, nest HTML inside the div
with the html
option.
Using the html
option within divIcon
, I can drop the emoji keyword and I have an emoji map marker.
var rocketIcon = L.divIcon({className: '',html:':rocket:'});
L.marker([38.91338, -77.03236], {icon: rocketIcon}).addTo(map);
I decided to take it one step further by pulling in places from Foursquare and querying the emoji keywords.
Try exploring your emojified city!
Hello Tom Lee!
Tom Lee has joined Mapbox! Tom comes to us from the Sunlight Foundation where he led the labs team in building technology for a more open government with projects like Open States, Clearspending and Sunlight’s APIs. At Mapbox Tom will help grow our data team, develop data policies and services, dive deep into OpenStreetMap, work with governments to open up more geodata, and build the data tools of the future. Welcome Tom!
Welcome Cathryn Stickel!
A big welcome to Cathryn Stickel, who is joining Mapbox to support our overall operations and our team as we keep growing fast. She comes to us from FrontlineSMS, where she helped transition from a nonprofit to a for profit company, open offices on three continents, and more than double the size of their team.
Join The Mapbox Directions Team
We’re building a routing service unlike any other and we want your help to develop it. It is flexible, fast, and customizable for every use case, from finding a path up a mountain, driving across the country, or navigating the streets of a busy city. To build this, we need people who know graph theory, efficient algorithms, and have the desire to run fast on creating a scalable API.
Native
While having a background in routing is a bonus, we’re really looking for top-notch C++ coders with a deep understanding of algorithms and data structures. Knowledge in cache effiency and I/O effiency are certainly a plus.
Open
Mapbox builds — and is built on — open source code. We maintain over 200 projects on GitHub, and internally we run everything from office maintenance to sales as repositories. We are huge supporters of the Open Source Routing Machine and appreciate candidates who understand the benefits of building in the open.
An opportunity
Here’s a challenge for you to pique our interest. The following is a classic problem from computer science:
Given a set of vertices V that describes a path in a graph, with each vertex assigned a weight. Find a subset of V that maximizes the sum of vertex weights without any two vertices in that subset being adjacent.
Get in touch
Got an idea how to solve this efficiently and elegantly in C++? Send the code along with a note about why you’re interested in Mapbox to jobs@mapbox.com. We’d love hear from you.
Predicting data curation in OpenStreetMap
Our data team is now using our cumulative statistics to predict areas that need better tracing in OpenStreetMap. The world is huge, how do you find out where the map needs improvement? You can’t look everywhere. To better guide our data team’s work, we compared OpenStreetMap data density with satellite imagery data density and intersected the results with traffic data from Mapbox.com.
We aggregated our logs for ~30 billion tile requests for a period of ~100 days and exported the location and zoom level of the top 50k most requested tiles. With tilebelt and mercantile we could easily convert the location of those tiles into a heatmap:
Top requested locations for a period of ~100 days. Pretty much population density, plus other hotspots areas like Null Island - courtesy Mick.
With our list of popular places we turned to the OpenStreetMap planet file and mapped the number of nodes for each tile:
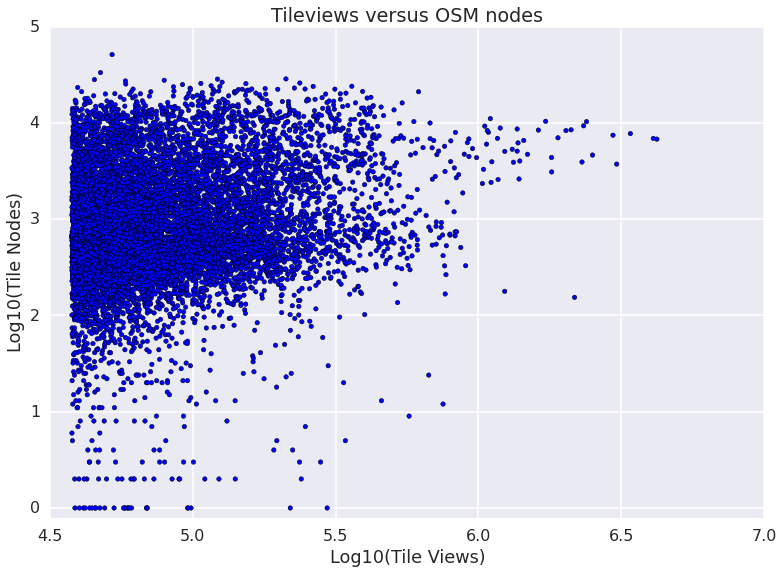
Plotting OpenStreetMap nodes against tile views gives an idea of the parameter space:
# Read and ranks tile nodes and requests from top 50k file
# z x y nodes lat,lon views
import numpy as np
with open( "./list.csv", "r" ) as txt:
raw = txt.readlines()
lines = [ line.replace(' ',',').replace('\n','').split( "," )[1:] for line in raw ]
v=array([np.log10(int(a[6])) for a in out])
n=array([np.log10(int(a[3])) for a in out])
scatter(v,n,c='b')
show()
Tile view count versus number of OpenStreetMap nodes.
Most tiles are located in a cloud of dots with 10-10k nodes and 100k-1M views. We used decimal logarithms to emphasize the spread in the order of magnitude. We are interested in relatively untraced yet requested places, which correspond to the bottom half of this cloud of dots.
To get a sense of tracing needs inside a tile we used another dataset, our Satellite layer. The hypothesis is that the Satellite layer can inform us about features. Then we can compare if these features are either traced (e.g. known roads), traceable (e.g. untraced roads), or if tracing is not needed (e.g. dunes in the desert).
Flagging features could be done automatically using complex computer vision or machine learning techniques but we wanted a quick and easy first step. We settled on using the tile file size of the same pngs used in our Satellite layer. This serves as an unapologetically cheap proxy for the density of features: Tiles that are well traced would have both many nodes and a larger file size and tiles with few or no nodes would tend to be small in a satellite image (e.g. water or desert). Hence, even when the units of each dataset are not related, the ordering of tiles would follow these same pattern. The discrepancy in the ranking order could then inform the possibly of features present in the Satellite layer that are missing in OSM. Let´s plot that:
Scatter plot of Satellite tile File size versus number of OpenStreetMap nodes inside the tile. The color is the discrepancy in the Ranking order.
Tiles with small file sizes tend to have fewer nodes and big tiles tend to have more nodes. The difference in the ranking is shown with a heat map color palette. Blue dots have more nodes than the typical file size indicating (for example low resolution, clouds or missing satellite imagery). Red dots indicate Satellite complexity with relatively few nodes. These are the tiles that might need tracing.
Isolating a list of the red section of the scatter we get tiles that are top requested and where Satellite imagery is complex and not traced. In many cases these are valid locations with untraced features but this quick approach has limitations. Places where no tracing is needed can show up, like coastal areas that are within the same view of cities (e.g. Manhattan). In addition, places with particularly high Satellite complexity and a low number of traceable nodes, like train stations, golf courses and urban parks (where a low density of nodes can fully map an area) can lead to false positives.
OpenStreetMap tracing candidate locations calculated with the method above. OpenStreetMap nodes are emphasized with a washed down Satellite layer underneath to emphasize contrast.
The end result is a list of tracing candidates ready to be traced, maximizing the impact of our tracing efforts. Stay tuned for more updates figuring out tracing needs and drop us a line if you want to know more or have some cool ideas to try.
Alison Anthes joins Mapbox
Alison Anthes has joined the Mapbox team! We’re excited to have Ali on board, playing a dual role of account manager and support, bringing new users on to Mapbox and helping existing ones better use our platform. Ali has spent the past few years in DC as a pastry chef in DC and a designer at The Container Store.
Walking directions API
Smart Directions is getting a huge upgrade, more than just helping people move around their city in cars and scooters— we now have walking directions, today in private beta. Our friends at RunKeeper have already integrated with the new API and are using it to power their new route planning app that snaps a path as athletes log their workouts.
In contrast to car directions, the new walking API allows access to every way in the data that is accessible by foot, unless explicitly forbidden. One-way streets and turn restrictions are ignored as if they were just normal streets with no restrictions at all. While streets and foot paths are equally weighted, we give preference to foot paths with a solid surface — paved paths are preferred over sandy surfaces.
Combined with Mapbox Outdoors, it’s easy to route paths up mountains or find the more scenic route through a city.
If you’d like to try out the new API, get in touch with us for early access.
DroneDeploy powered by Mapbox Upload API
DroneDeploy’s cloud-based drone management and imagery processing makes it simple to plan a mapping mission, launch the UAV, collect imagery, transmit data to the cloud for processing, and receive high resolution imagery products in a web browser. DroneDeploy’s developers are using the new Mapbox Upload API to upload finished ortho imagery products to mapbox.com, where they can integrate the data into their web application via our Javascript API, mapbox.js.
DroneDeploy’s application includes an imagery viewer where users can explore their imagery, see changes over time, and understand context through data overlays from Mapbox Streets and other vector data. Take a look at their web application in action:
DroneDeploy’s web application allows users to swipe through images captured on different dates.
I will be blogging more about the Upload API in a few weeks as we look to open this up to a wider audience. Ping me on Twitter if you want to talk about mapping and imagery collection with drones.
Videos from FOSS4G and JS.Geo
The recent open source geo-week in Portland, Oregon was a big hit and we’re happy to share our videos and slides that are now online. Here’s a quick recap of our talks at the FOSS4G and JS.geo conferences.
FOSS4G Sessions
How Simplicity Will Save GIS - Vladimir Agafonkin
It’s 2014 — we have consumer robots and electric cars, private spacecraft, planet colonization projects, and the Higgs boson is confirmed, but GIS software is still a mess. How do we reverse this GIS entropy? What does it take to turn complex technology into something that anyone can use and contribute to?
Mobile vector map rendering with Mapbox tools - Justin Miller
Rendering maps from vector data is the next wave in custom cartography, and nowhere is this more important than on mobile devices. Let’s look at what’s possible with Mapbox GL, including client-side map style customization and influencing the user experience with sensor inputs, and talk about high-level design goals of the tools and where they are headed next.
Vector tiles for fast custom maps - Dane Springmeyer
Vector tiles are becoming a common solution for fast clientside rendering of spatial data in both browsers and mobile devices. We’ll cover the open source technology under the hood in Mapbox Studio as well as the status of an emerging specification for vector tiles and recent advances in the format.
Fiona and Rasterio: Data Access for Python Programmers and Future Python Programmers - Sean Gillies
Fiona and Rasterio are new GDAL-based Python libraries that embody lessons learned over a decade of using GDAL and Python to solve geospatial problems. Among these lessons: the importance of productivity, enjoyability, and serendipity to both experts and beginners.
Implementing change in OpenStreetMap - John Firebaugh
In 2013, I was involved in two substantial technical changes to OpenStreetMap: a new default editor and a redesign of the website. Because OpenStreetMap is a collaborative project, these were as much social as technical efforts.
FOSS4G Workshops
Mapbox Studio Fundamentals - An introduction to the successor of TileMill, Mapbox Studio. Covers getting started with Sources and Styles as well as basic CartoCSS.
Leaflet and Mapbox.js API Fundamentals - Basics of the Leaflet JavaScript mapping library and how the Mapbox.js API acts as a plugin on top of Leaflet.
JS.Geo
The lead developer and founder of Leaflet, Vladimir Agafonkin, shares some history and the roadmap for the world’s most popular mapping library.
Lauren Budorick explains the nuts and bolts of OpenGL for cartography and how it ultimately changes the speed of rendering your maps.
Two step verification
Mapbox now offers an additional level of security for your account: Two-step verification. Once enabled, you’ll be prompted to enter a security code generated by your mobile device each time you login.
Two-step verification is optional, but we highly recommend it for all accounts. Enable it today from your account page.
It’s easy to set up. Just scan the barcode using an authenticator app on your mobile device. We recommend using Google Authenticator. It’s free and available for iOS and Android.
Type the 6-digit code the app returns back into field below the barcode to complete the process.
Ta da! You’re now even more secure using Mapbox. Questions? visit the help page to learn more.