A new solution for bringing live data into complex maps
By: David Wicks and John Branigan
Presidential campaigns are reaching a tipping point with primaries and caucuses finally underway, and after an anti-climatic election debut with delays in Iowa, millions are still impatiently awaiting results.
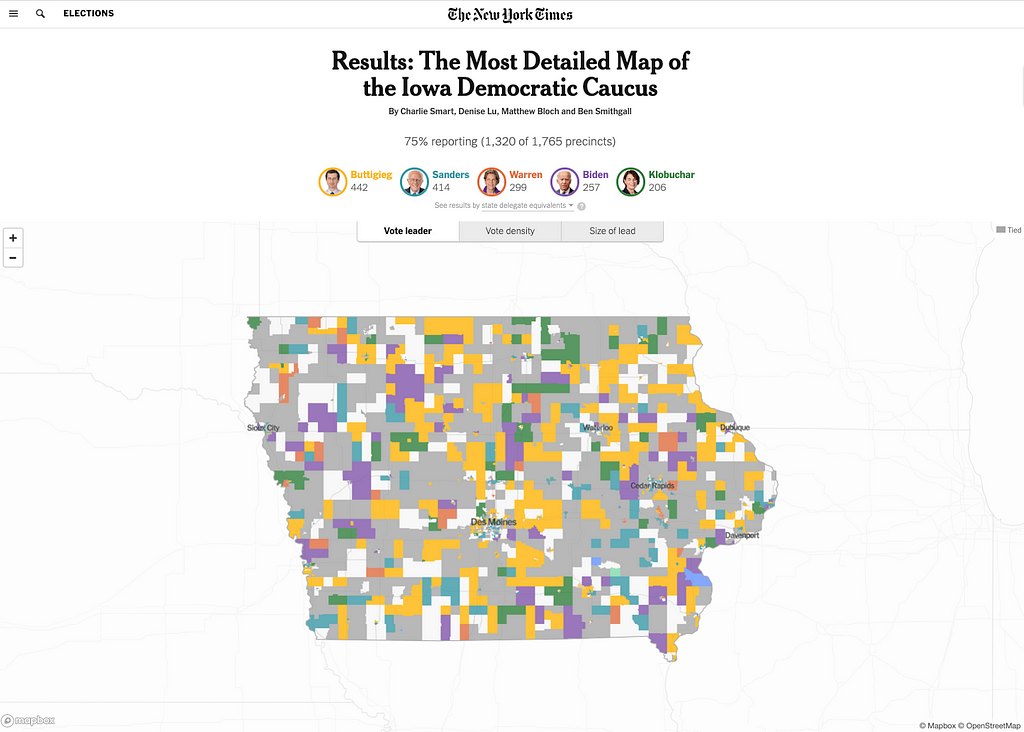
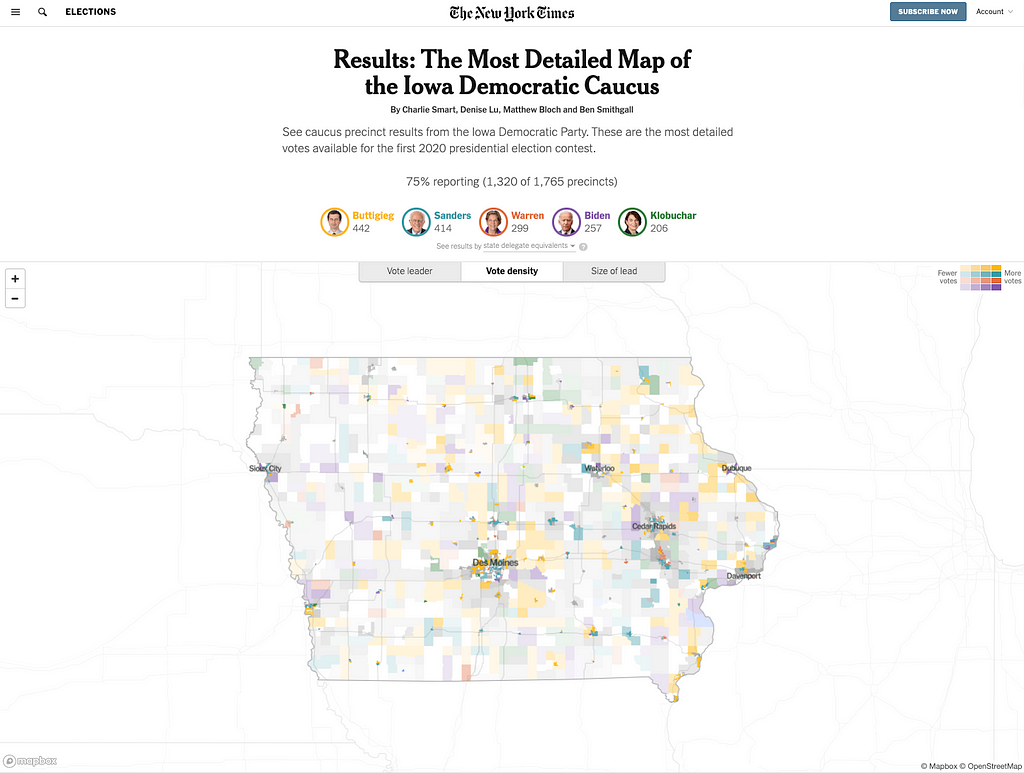
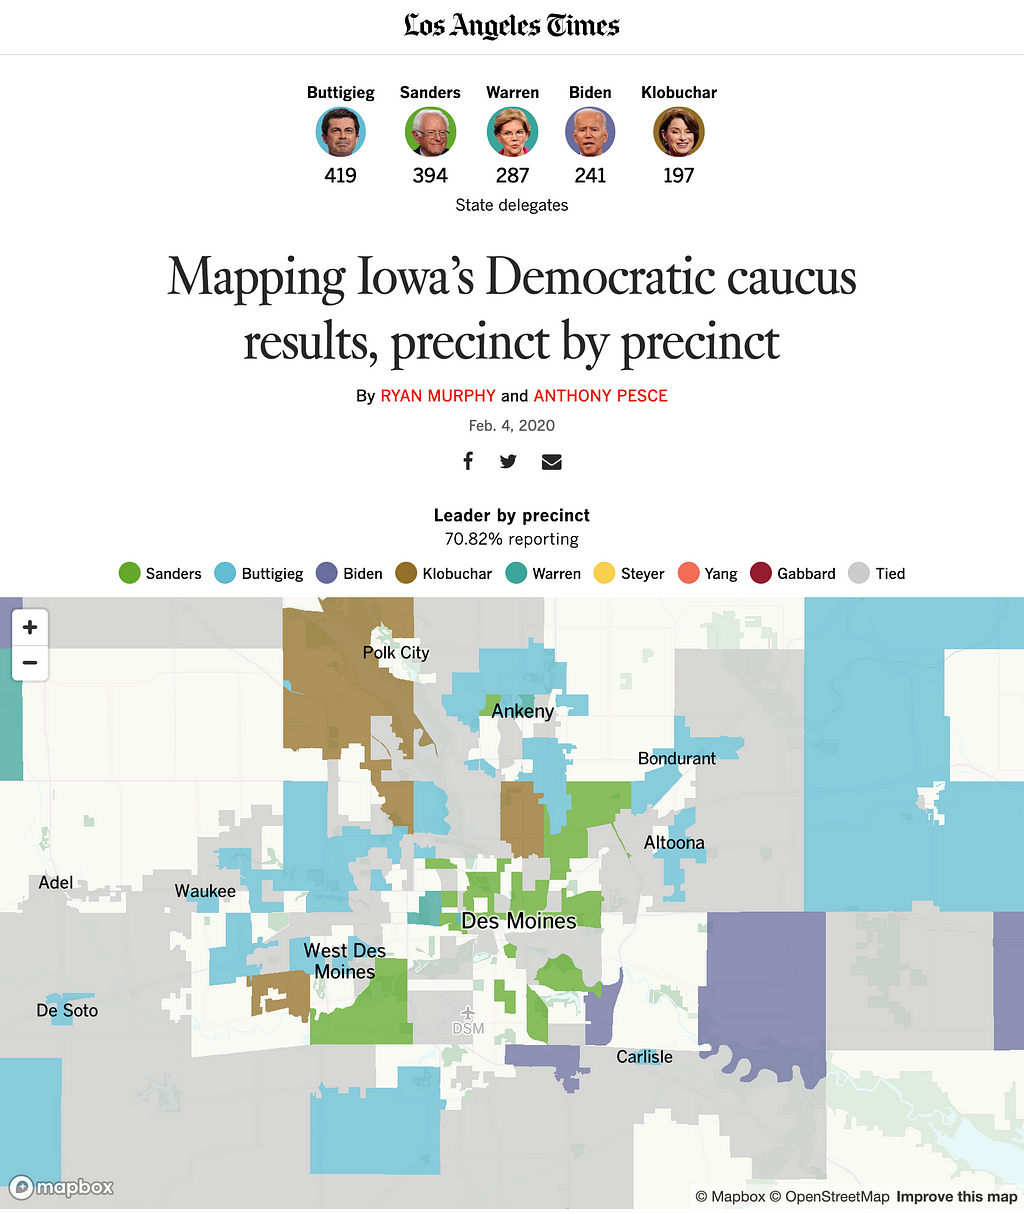
Both the New York Times and the LA Times displayed highly detailed precinct maps of the caucus, which started finally filling up on Tuesday after the results began to trickle in. In spite of unprecedented trouble on the ground, they managed to create performant, minute-by-minute rendering of electoral returns, using Mapbox.
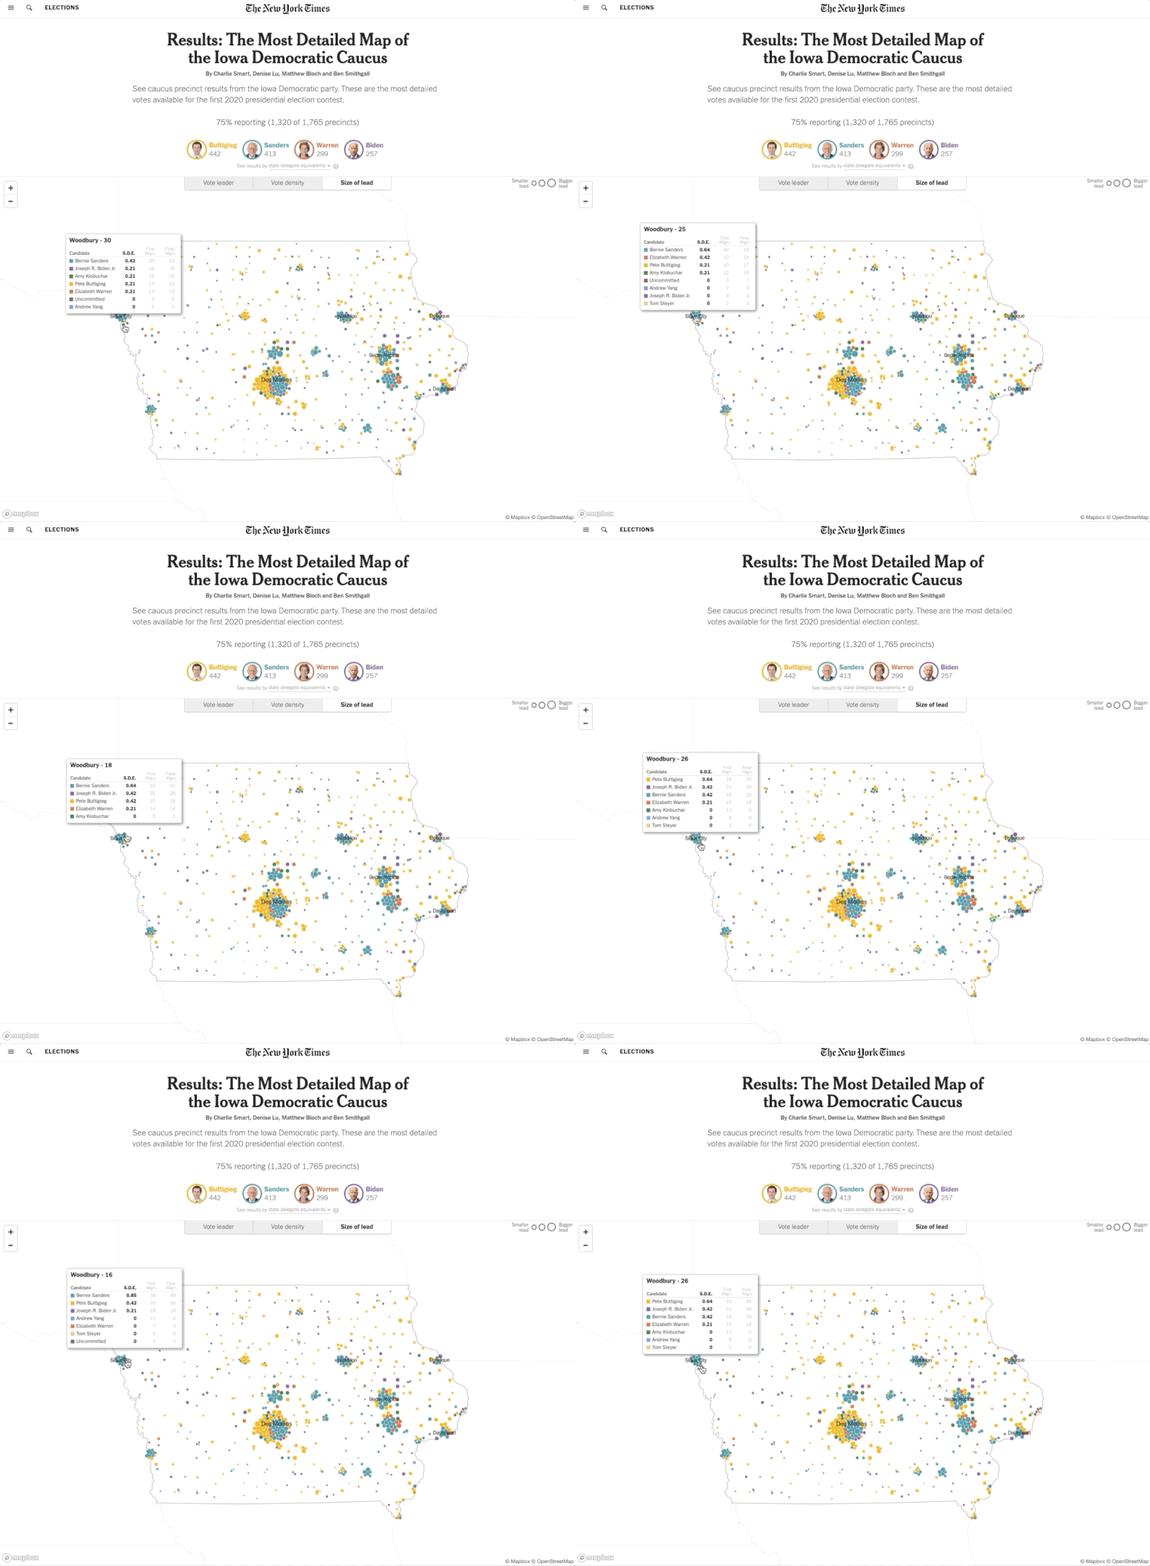
Being able to widely distribute a live visualization with this level of performance is no small feat. During live coverage of elections, megabytes of data are updated every minute and then joined to their respective geometries — that’d be over 1,700 precincts for Iowa. We want Mapbox users to be able to reproduce similar results. So today we are introducing a solution that will help you produce real-time visualizations using data-joins and feature-state.
With this solution, we’re making it easier for advanced users to join live datasets to geometries in a Mapbox tileset. By pulling geometries and attribute data from separate sources, then joining them in the browser for rendering, the visualization stays light and performant. This approach is perfect for scenarios where mapping involves large external datasets requiring minute-by-minute updates and unchanging geometries — like precinct and county boundaries.
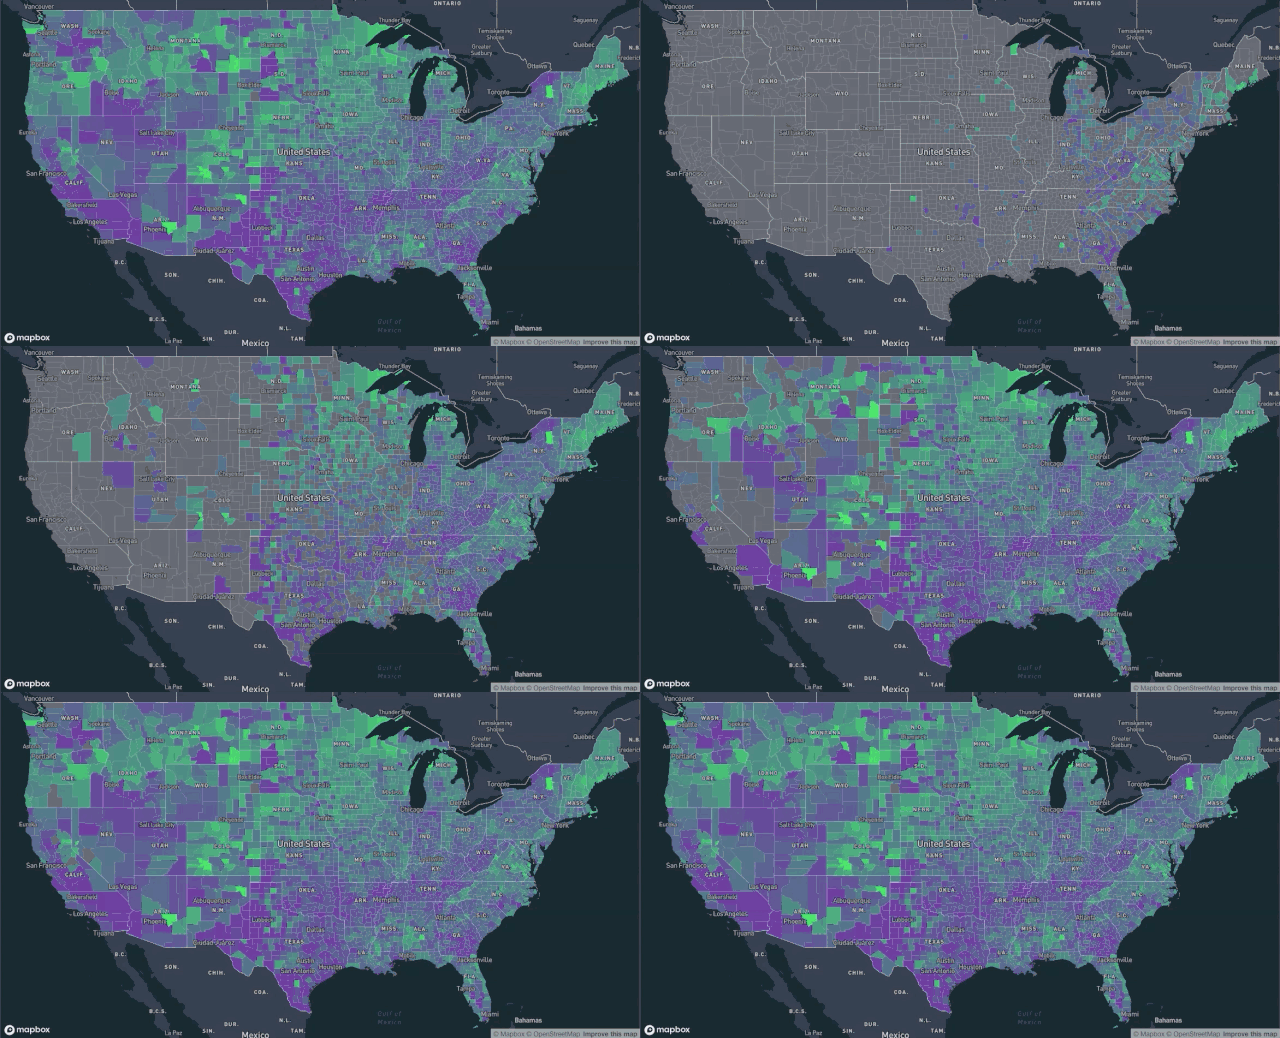
The coding pattern introduced in this solution solves many challenges around performance, data availability, and scale. Using Mapbox GL JS feature-state, this app takes on some of the heavy lifting — like complex expressions for data-driven styling and provides one of the building blocks to create a robust data pipeline and clean visualization.
Dive into the details and get the source code from our solutions page to start building your own real-time apps or visualizations. Reach out to our team with any questions, and share what you build on Twitter using #builtwithmapbox.
- David Wicks - Solutions Architect - Mapbox | LinkedIn
- John Branigan - Solutions Architect - Mapbox | LinkedIn
Maps feature data from Mapbox and OpenStreetMap and their data partners.
Real-time election mapping was originally published in Points of interest on Medium, where people are continuing the conversation by highlighting and responding to this story.