Recreating a legendary style
By: Madison Draper
I have a special story for you today. Once upon a time, a young cartographer named Madison (👋 ) joined up with a magical bunch of space pirates. She met many jolly souls, but one particular map wizard put endless time and energy into training the young apprentice. Saman was a long-time veteran of the space ship Mapbox, but his tenure made him generous, not salty. After a year and a half, the apprentice was finally ready to create her big thank you to him.
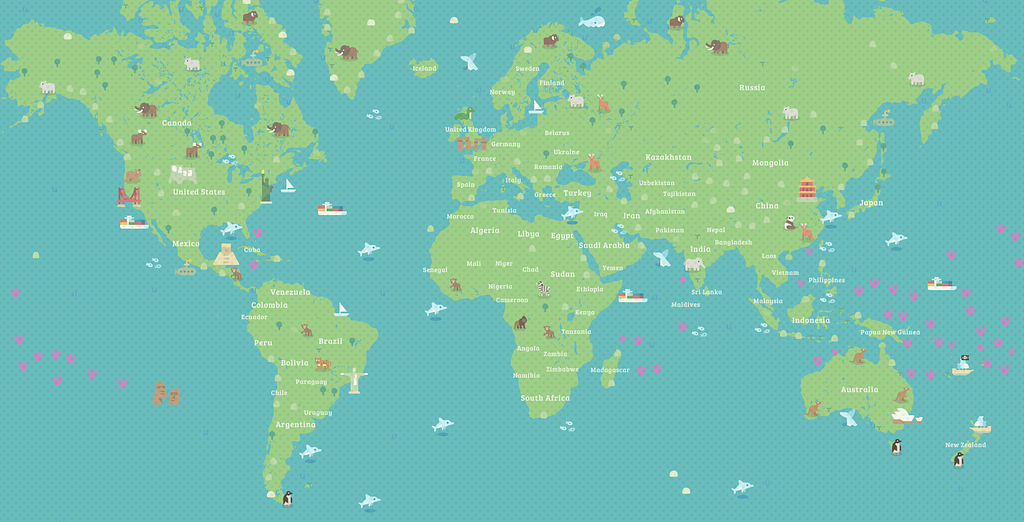
Picture book is a remake of a Saman’s Picture Book style that he created a few years ago with Mapbox’s first set of design tools, Mapbox Studio Classic. (He even made a cool landmark quiz to go along with it.) Studio has changed significantly since then so I recreated Saman’s style so you could use it, too.
Vector tiles
Mapbox Studio renders maps with Mapbox GL running in the background and harnessing WebGL’s power. A vector tile is a lightweight data format for storing geospatial vector data, such as points, lines, and polygons. Vector tiles are used to create Mapbox vector tilesets. Vector tiles can be used as sources for styles or queried directly to create interactive experiences with the Mapbox Mobile SDKs and Mapbox GL JS. Vector tiles encode geographic information according to the Vector tile specification.
Studio Classic used raster tiles. Raster data is a pixel-based data format in which data is stored in a grid structure. Each pixel, or unit of information, has the same size and shape, but varies in value.
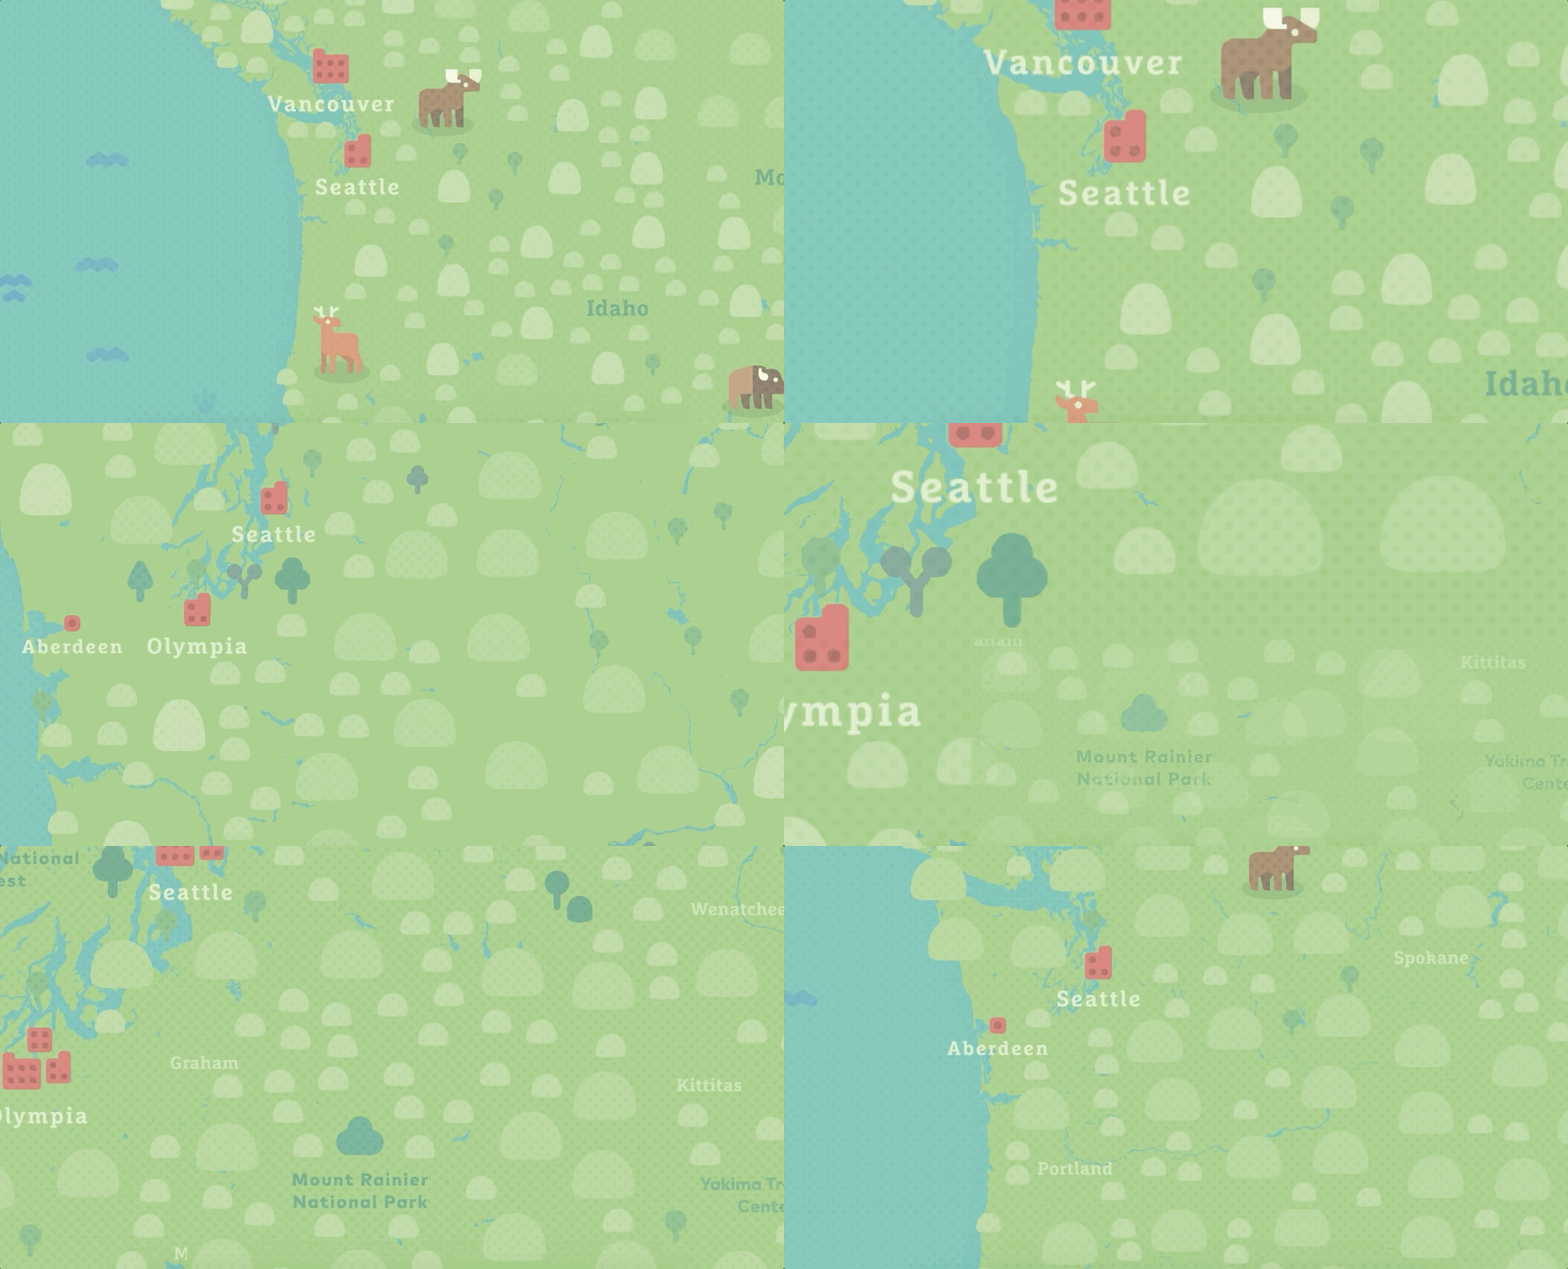
On a map, the difference is obvious. Vector tiles smoothly transition between infinite zoom levels, and allow for features to change within a tile. Raster tiles have a more apparent stepped transition and can’t change feature appearance until a new tile is reached.
Expressions
Expressions were introduced a little over two years ago with Mapbox v0.41.0. Expressions build on data-driven styling, a feature that allows you to dynamically style spatial data based on its properties. Expressions allow for data to be styled by multiple feature properties at once, conditional logic, and data manipulation with arithmetic and string operations for a more sophisticated relationship between the data and how it is styled. The Mapbox GL style specification docs include a full list of available expressions.
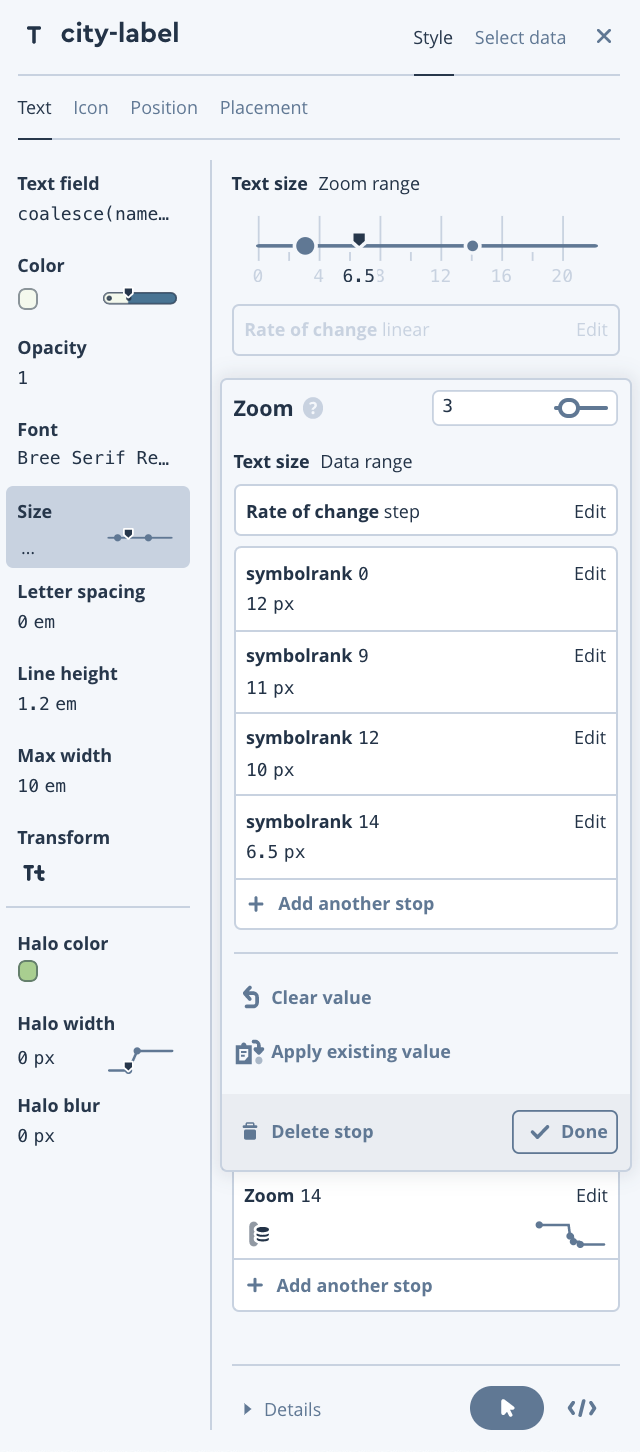
To take full advantage of data-driven styling and zoom-driven styling, I used expressions to change city label sizes’ based on the cities’ symbolrank value and the zoom level. The exact expression I used can be seen below.
In Mapbox Studio’s UI, it looks like this:
SVG textures and icons
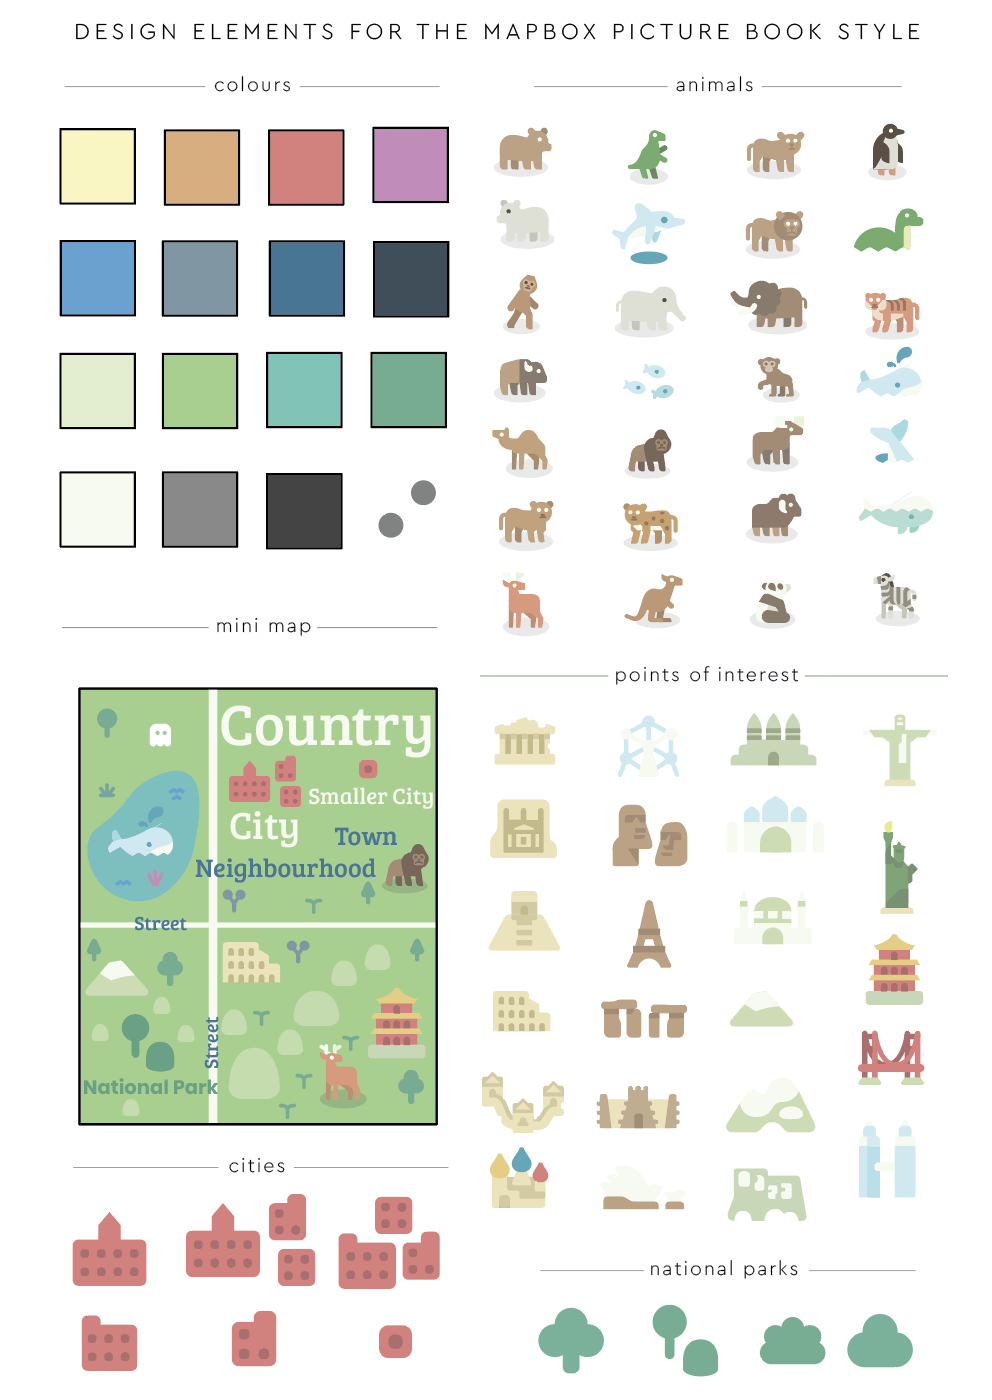
Mapbox GL allows for scalable vector icons to be added to the map. Below is a breakdown of all the colors, icons and textures used in the Picture Book map style. The svg icon set uses bold colors and gives the map its child-like personality.
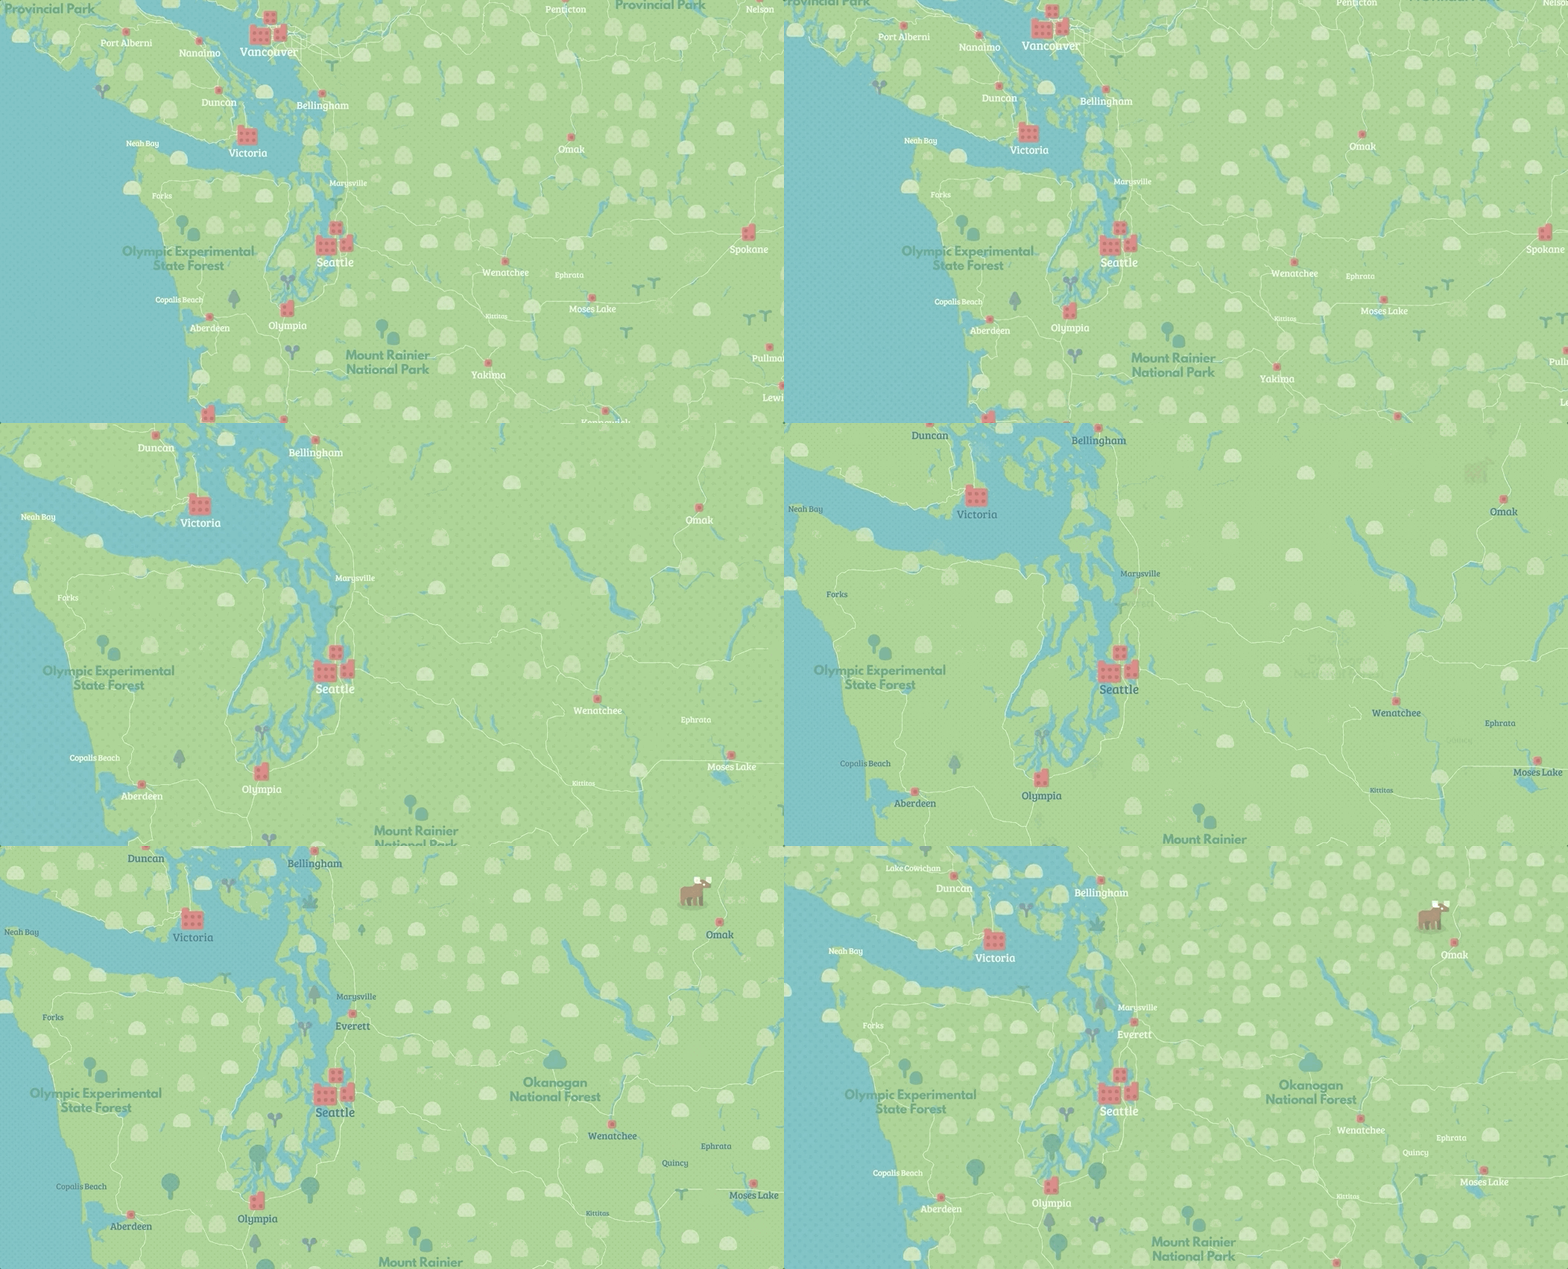
Taxonomy charts are a critical step in our cartographic process. Because the world is so large, it’s nearly impossible to look at every section, so taxonomy charts help us to view and tighten the design elements of the map abstracted from the geographic context. Mini-maps allow for manual testing of different design elements next to each other. This helps find immediate color and sizing clashes quickly.
To create the textured background, the halftone (two dots) repeat over all features except for text for legibility.
High resolution printing in Mapbox Studio
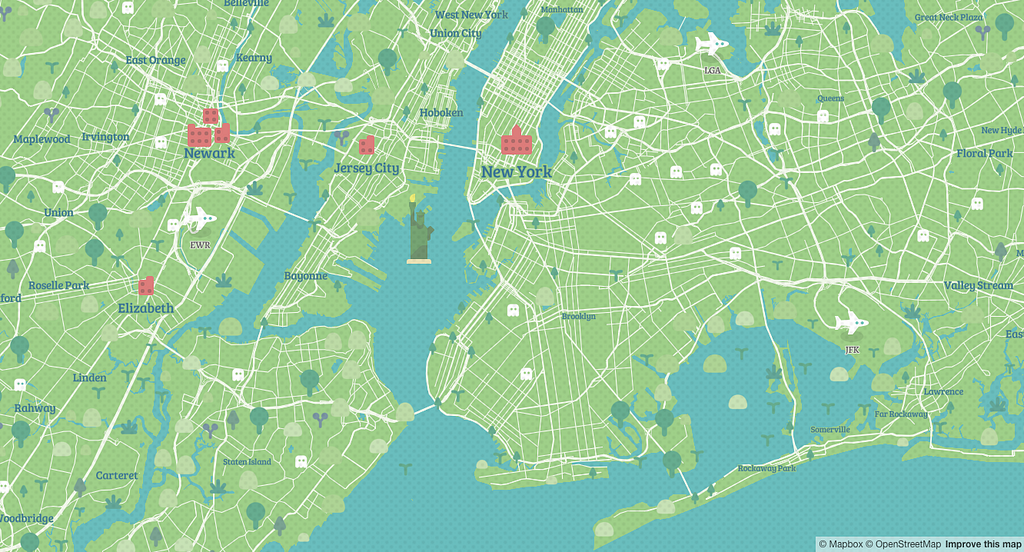
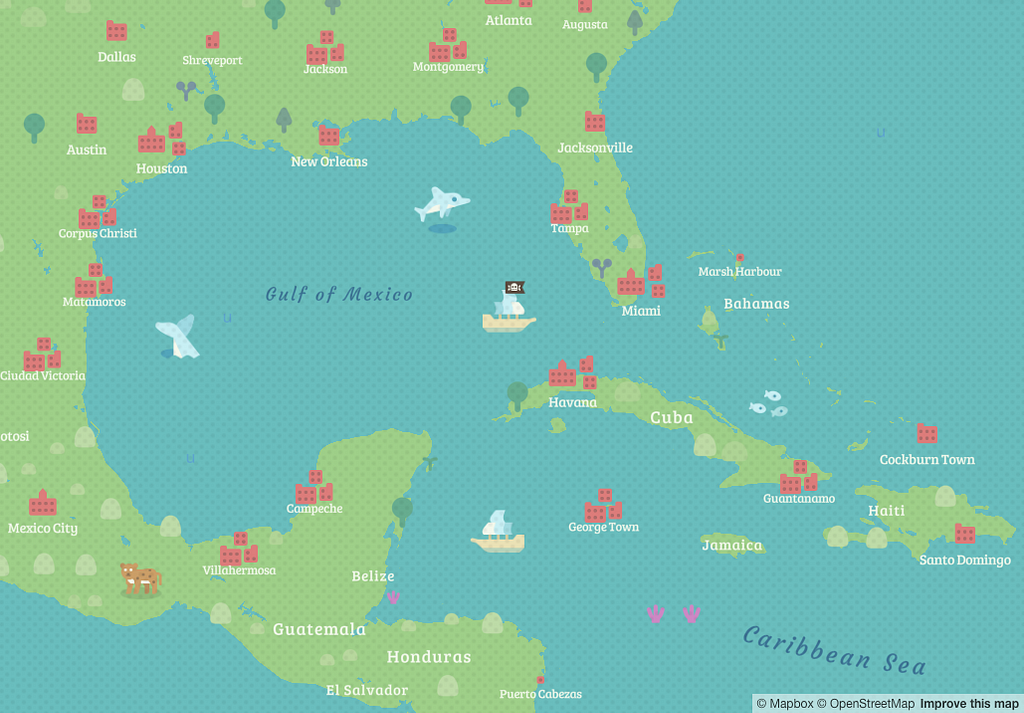
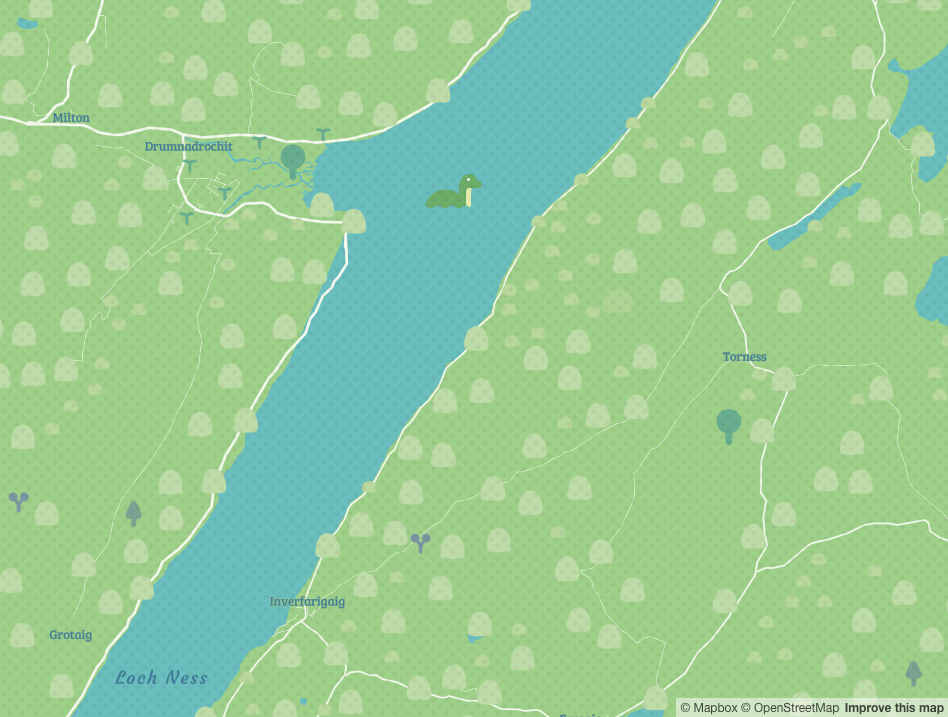
Picture Book’s fantastical map styling make it an ideal backdrop for stories. Print out landscapes with Mapbox Studio’s high resolution print feature by pressing the print button in the top right corner. For a step by step tutorial, check out this blog post.
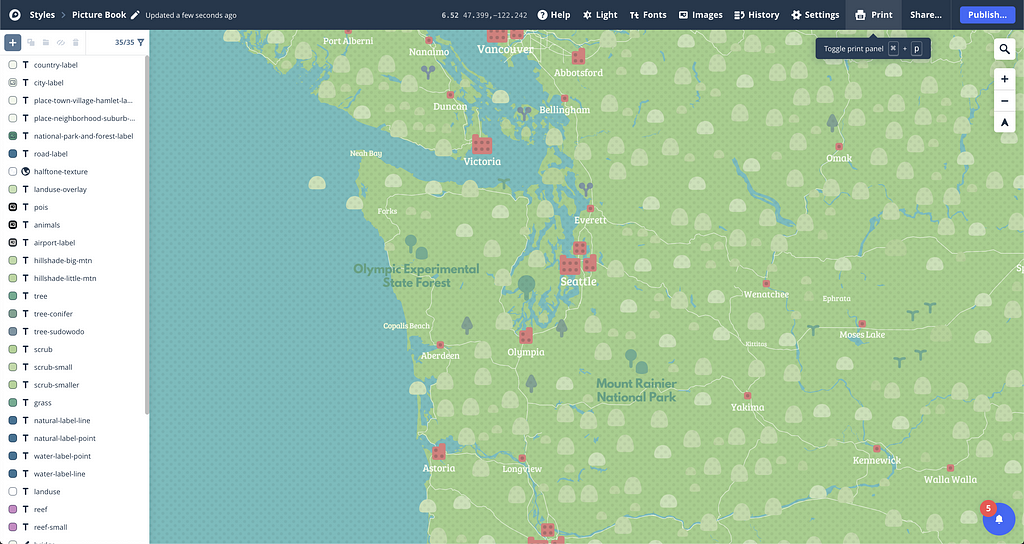
Add Picture Book to your account and make it your own. See if you can find all the custom point of interest markers, and tweet us your favorite screenshots. And give Saman a follow too while you’re on Twitter. He has some amazing work that you don’t want to miss!
The story of Picture Book was originally published in Points of interest on Medium, where people are continuing the conversation by highlighting and responding to this story.