By: Lo Benichou and Asheem Mamoowala
This is part two of a guide series on electoral maps and data visualization. Make sure to check out part one, on using expressions to visualize election results.
It’s election night. Results are coming in. Anyone who has ever feverishly refreshed a results page in a close race knows — it’s all about up-to-date results, as fast as you can get them. For maps showing live results on election night, the winner is Feature State.
With Feature State, you can update the “state” of a feature at run-time, allowing control over the style of the individual feature without the map rendering engine (Mapbox GL) having to re-parse the underlying geometry and data. This offers a significant boost in performance, especially when visualizing live election data that’s updating every few seconds.
Historically, our map renderer has been optimized for vector and raster tile sets that are relatively static, so you can continuously update data on the map with GeoJSON sources, but it doesn’t scale well for large or fast-changing datasets. Starting with the Mapbox GL JS release v0.48.0, the Feature StateAPIs can be used to dynamically style features in vector or GeoJSON source data, enabling new ways to handle map interactivity and joining data to vector tiles.
The examples in this post will be using the same dataset used in Visualizing Election Data: a guide to Expressions.*
*Note that there may be some inconsistencies in the data as FIPS code may change over time.
Technical Specs
Application
Feature-state is a set of user-defined attributes that can be dynamically assigned to a feature on the map and used to style features with expressions. For instance:
In plain English, this says:
“If the feature-state called ‘hover’ is false, then the opacity should be 1, otherwise it should be 0.5”
Note that ‘hover’ doesn’t hold any special meaning and can be arbitrarily defined by the user. You could have ['boolean', ['feature-state', 'woot'], false], for instance.
These attributes can be loaded from external data, generated at runtime, or loaded from a local cache and applied to vector and GeoJSON sources using the Map#setFeatureState method. Like this:
The feature-state expression can be used to style any of the paint properties that support data-driven styling with values from these attributes. Check out our style specification for paint property support levels.
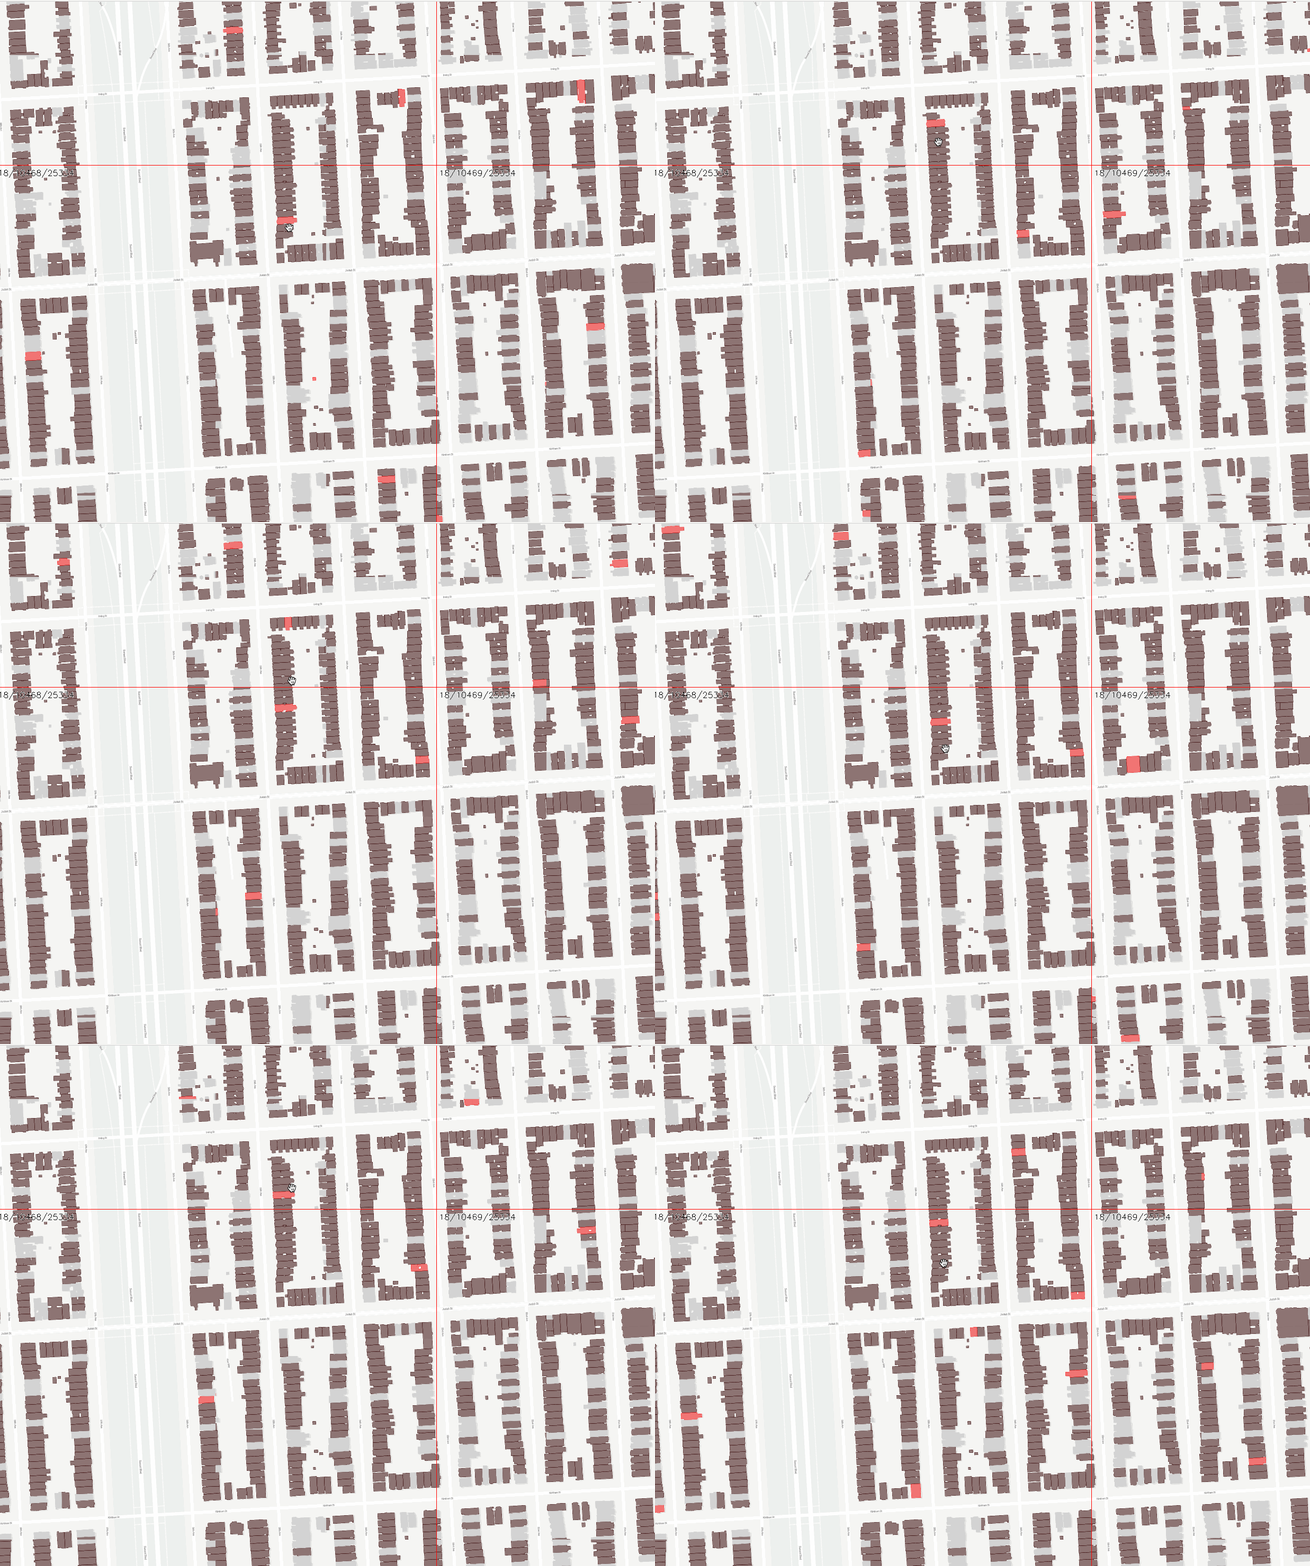
Features are identified by their id property and must be unique across a source or source layer. This is not the same as adding an id attribute to the feature’s properties object.
If the ids are not unique, the state changes will affect all features with that id, as you see below:
Limitations
While Feature State is very performant, it’s important to note some of the current limitation of this experimental feature. For one, layout properties and filters aren’t currently supported.
Additionally, in order to correctly update the properties of a specific feature on a map, the SDK relies on the top-level feature id attribute which must be unique to work. The ids also have to be integers or strings cast as integers (e.g. “03989” or 3989). This can make data preparation a bit tricky.
When uploading data to Studio, the Uploads API strips ids unless the data files are MBTiles. So here are a couple of ways you can prep your data to use feature-state:
- Use tippecanoe to convert your GeoJSON files into MBTiles using the -ai/--generate-ids flag to generate unique ids:
tippecanoe -o output.mbtiles -zg --drop-densest-as-needed --generate-ids input.geojson
From there, you can safely upload your tiles to Studio and use feature-statein your code.
- Use the generateId option directly in your code. If using a GeoJSON source without pre-existing ids, use the generateId option to ensure all features have unique ids.
Both methods will yield the same results. However, if you have a large GeoJSON, I would strongly suggest you use tippecanoe to convert your files.
The following examples will show you the different applications for feature-state and detail the technical specs mentioned above.
Feature-state in Action
External GeoJSON and Hover
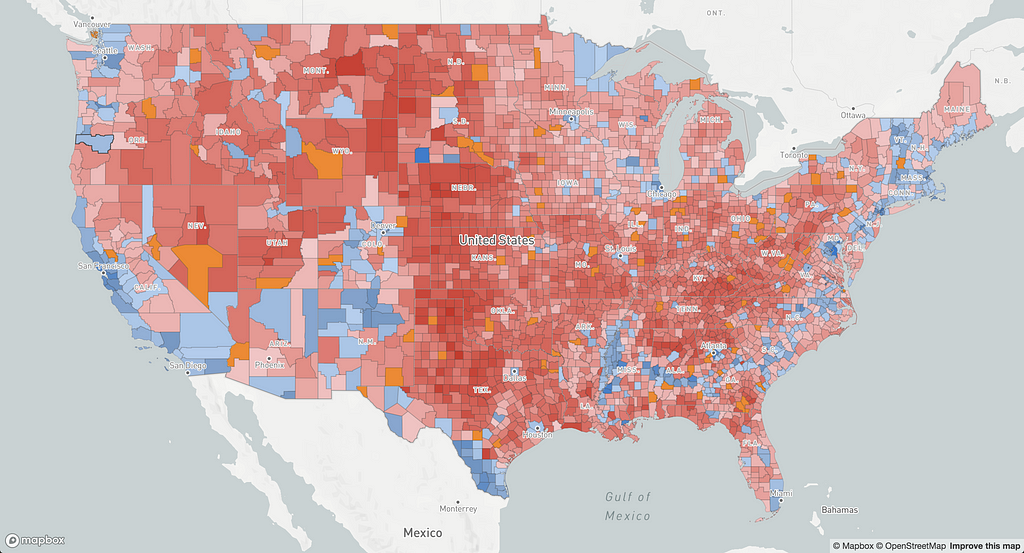
In this example, we will use an external GeoJSON created using QGIS. The file combines the 2016 Presidential election results per county and boundaries from the U.S. Census. To merge the two, I did an attribute join, matching the GEOID attribute in the shapefiles with the combined_fips column in the CSV file. The plugin I used is called MMQGIS.
Now that we have the data ready to go, you will notice that our GeoJSON doesn’t have pre-existing ids. To use feature-state, we must generate ids with the generateId option:
Then, we use a feature-state expression to dictate the layer’s fill-opacity on changes to the “hover” attribute’s state:
Note that the feature-state expression will evaluate to null until Map#setFeatureState is used to assign values to a state attribute, so it is recommended to add a fallback to expressions that encompass feature-state, like this:
For the interaction to actually work, we also need to assign a value to the “hover” attribute using Map#setFeatureState:
Let’s break down the setFeatureState() function:
- source: ‘counties’, the source in which to look for the feature.
- id: hoveredStateId, the id of the hovered feature.
- hover: true, the attribute we want to set. In this case, it’s “hover” and we’re setting it to true or false.
Now, when a user hovers on a county, the county’s fill-opacity will go from 0.6 to 1. This was a very simple use case for feature-state but let’s see how we can use it to tell a story about electoral results.
MBTiles and Highlighting Similar Features
The great thing about feature-state is that it enables you to update specific features very fast. In our next map, we’re going to highlight counties with similar properties on click and instead of using a local GeoJSON, I am going to show you how use tippecanoe and upload my tiles to Studio. In your command line, type:
tippecanoe -o countiesAndResults.mbtiles -zg --drop-densest-as-needed --generate-ids countiesAndResults.geojson
Then, upload countiesAndResults.mbtiles as a tileset. Once the upload is complete, you will have access to a url:
Next, you can setup your layers, including one that will be solely use to highlight similar features:
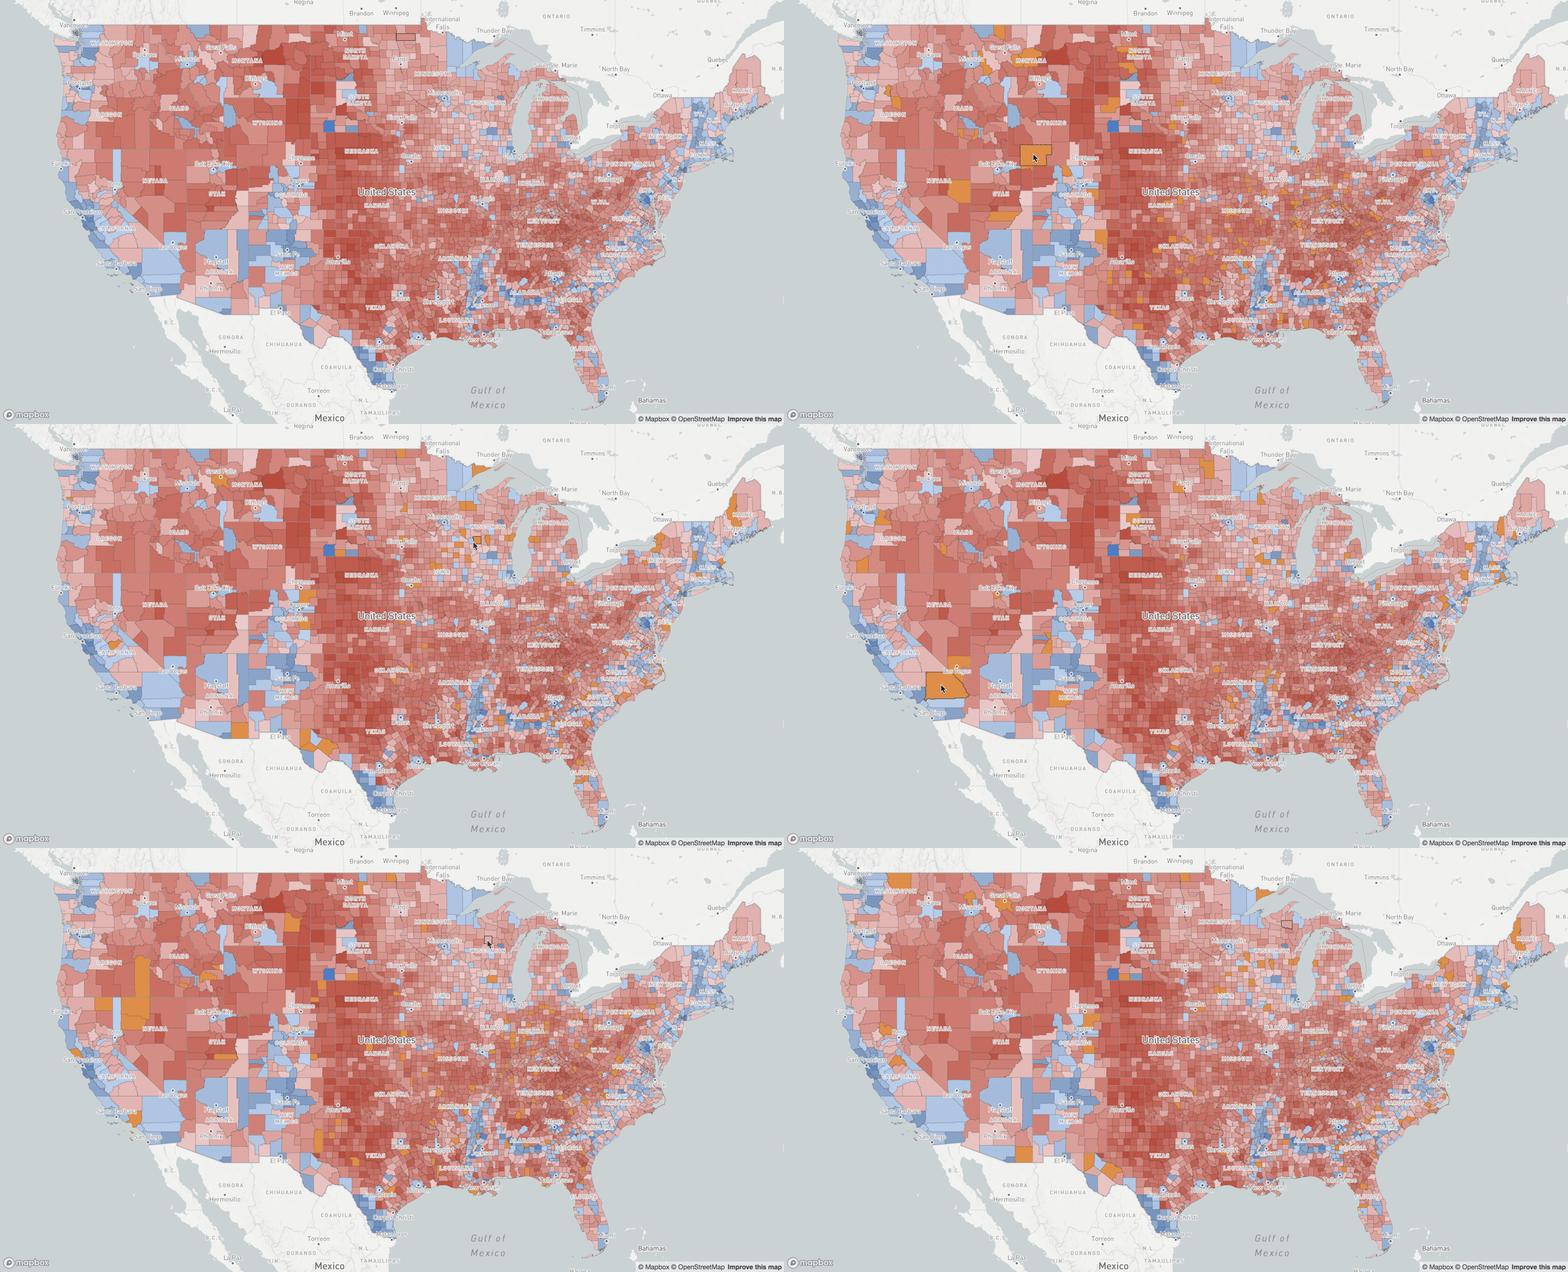
This is very similar to our first example, except that this interaction should happen on click. Once a user clicks on a county, we want to highlight counties with a point difference falling within +1%/-1% range:
The result:
Joining External Data for Live Updates
On election night, updating maps quickly and efficiently is key. A common scenario would be to have two separate files: one file with boundaries in a GeoJSON or shapefile format and another with incoming results in the form of a JSON. In that case, using generateId won’t work since the JSON data won’t have the matching ids. It is possible however to join the data to vector tiles or to an external GeoJSON file using feature-state but certain conditions must be met:
- The data in the JSON file and the features in the GeoJSON file should have a common property.
- That property should be an int or a string cast as an int (e.g. “0637” or 637).
- Converting this property should not result in duplicates.
If all of these conditions are met, you can promote that property to top-level feature id and join the data at runtime. Here is how it all works.
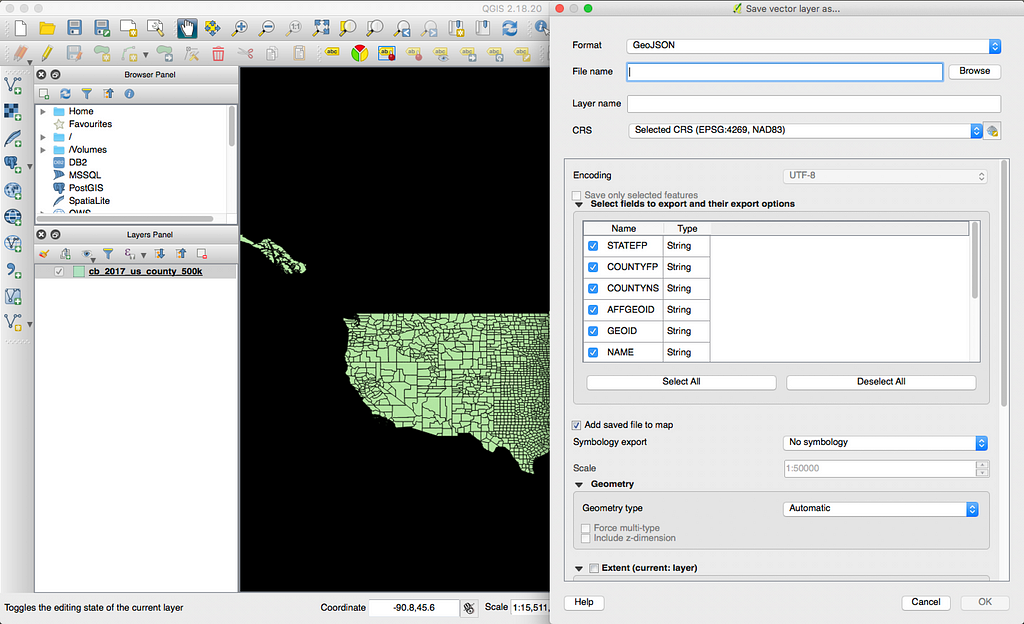
We’re going to need a GeoJSON with our boundaries. You can find the files here and we will need to convert them to GeoJSON. We can do so using QGIS.
Next, we need to prepare the results. I currently have a CSV file with 2016 Presidential results that needs to be converted to JSON. Most converters will allow users to turn a numerical string into an integer. For this use case, we want to make sure to check that option for combined_fips.
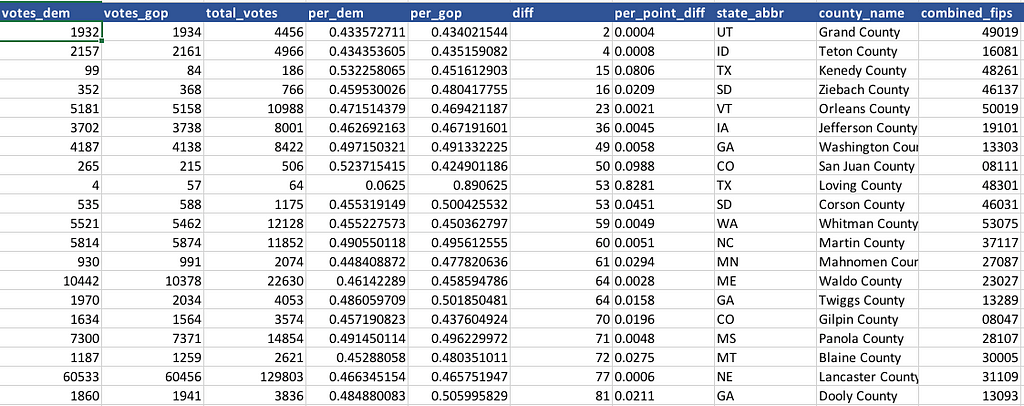
Once we have our JSON, we can promote the GEOID property in our GeoJSON file:
This python snippet will assign the GEOID property as a feature id and convert it into an integer:
At the end of this process, we should have two files with a common id that is both unique and an integer. We can load our GeoJSON locally or we can convert it into vector tiles using tippecanoe and upload it to Mapbox.
To join our data, we create a Map object using combined_fips as keys with a winner and a diff property:
The initLayers() function will encapsulate the layers, the data joining, and the data-driven styling:
For the full code, check out this jsFiddle.
Do you have questions about feature-states or expressions? You can email me at lo@mapbox.com or tweet Lo Bénichou.
Live Electoral Maps: A Guide to Feature State was originally published in Points of interest on Medium, where people are continuing the conversation by highlighting and responding to this story.