By: Chloe Krawczyk
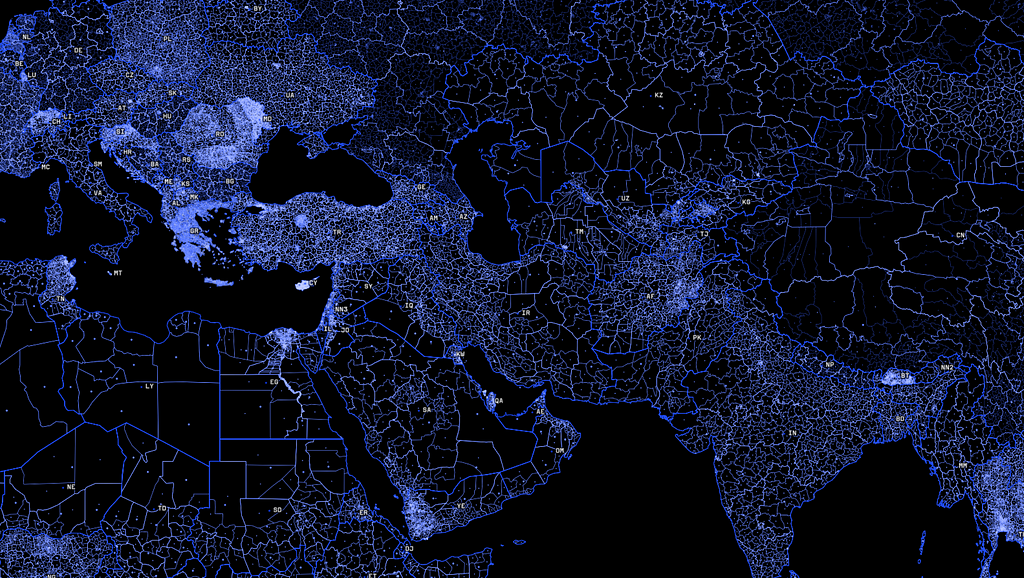
For data visualization, context matters. But, with an ever-changing world, it’s difficult to deliver straightforward, accurate, and up-to-date maps, while also being able to drill-down and understand big location data. That’s why we’ve meticulously reviewed every single country in the world to provide a refreshed set of administrative, postal, and statistical polygons ranging from local municipal jurisdictions to international borders. All of this is running on our latest version of Enterprise Boundaries, released today.

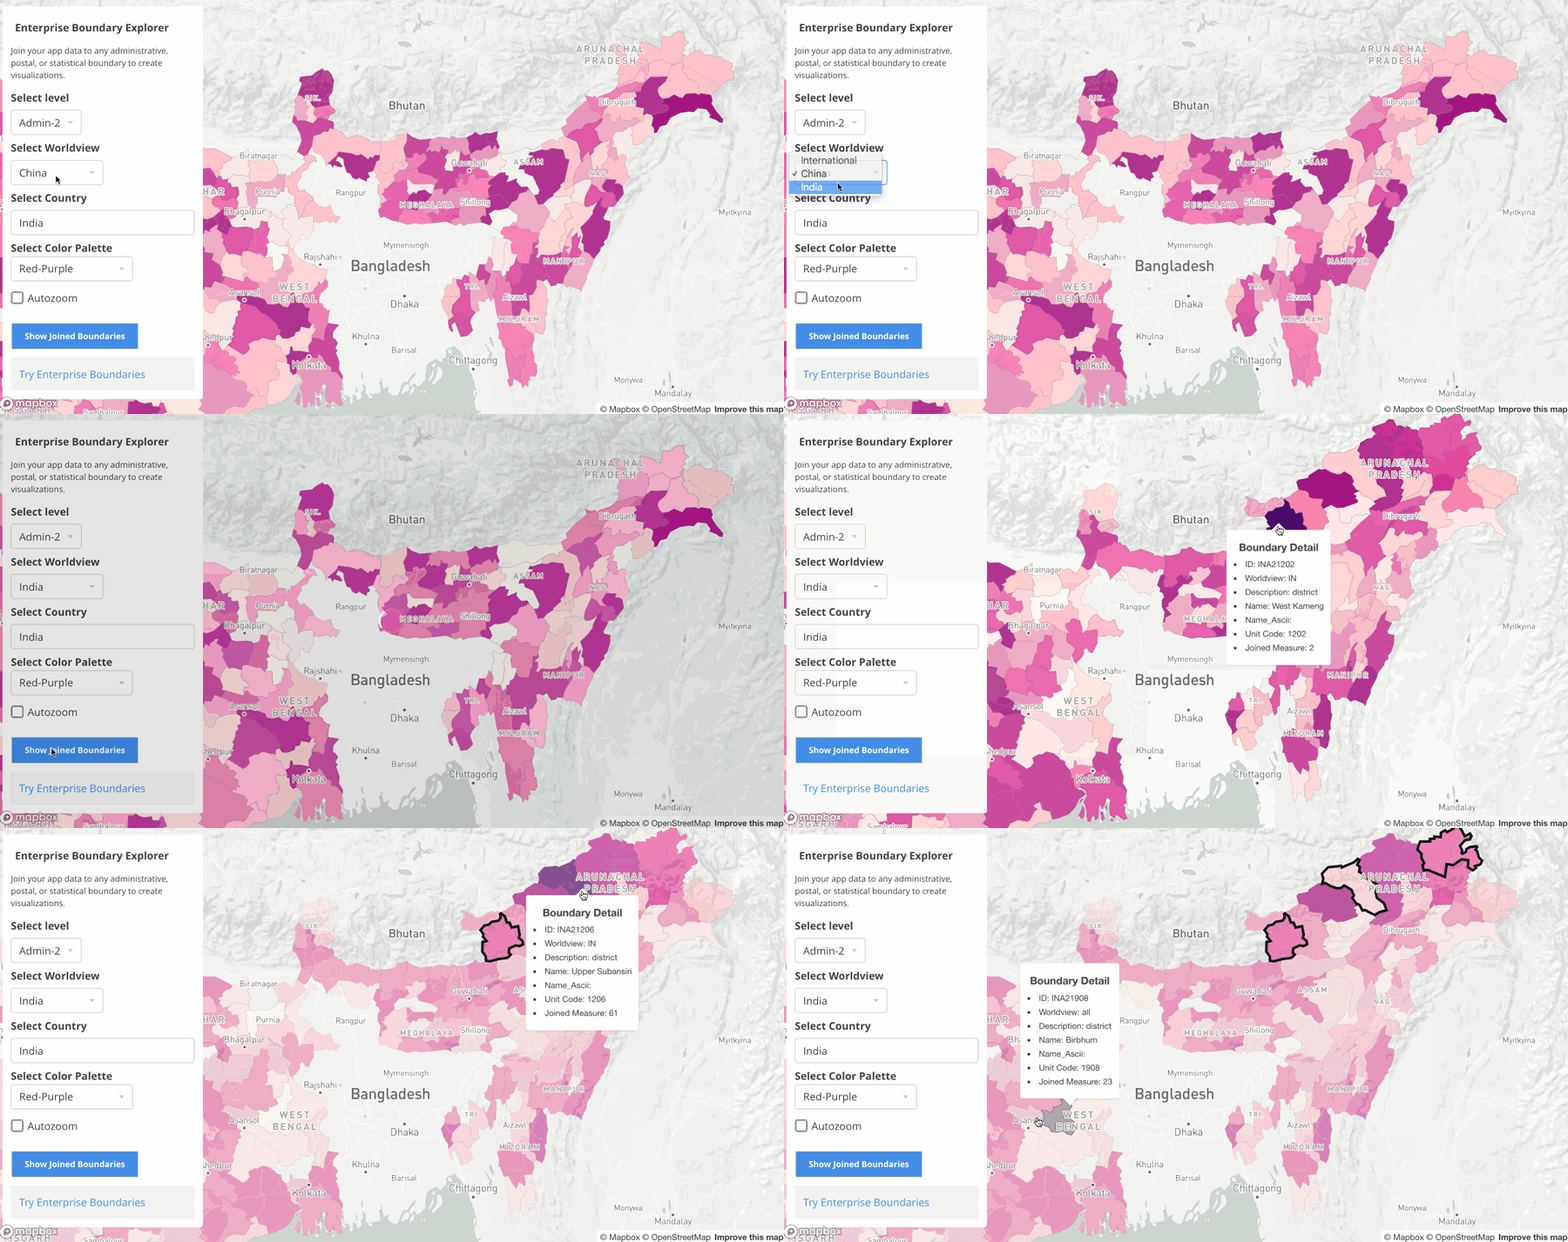
Typically, companies that work with boundary data have entire teams responsible for making boundary data usable. With Enterprise Boundaries, we did the work for you. You can add Enterprise Boundaries onto your existing basemaps and style them in Studio; join your data to boundaries using our data-join technique; or build dashboards with Atlas, our on-premise solution — all with just a few lines of code.
Before, we consistently heard customer feedback requesting more detailed polygons for their maps to perform granular data analysis quickly. Now, with MicroStrategy Geospatial Services, our customers can leverage the entire Mapbox platform, and are thrilled they can drill down into data from the country level all the way down to municipalities and quickly glean insights from billions of data points.”— Jose Nocedal, Vice President — Group Product Owner at MicroStrategy
In this release, we’ve also added:
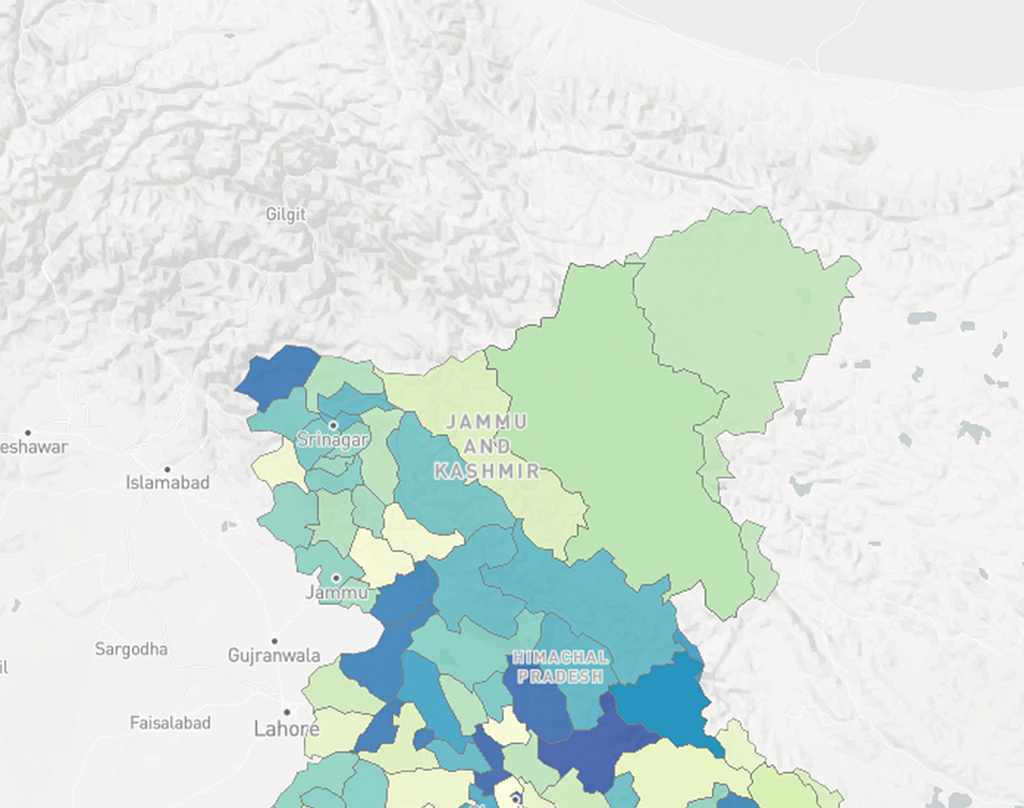
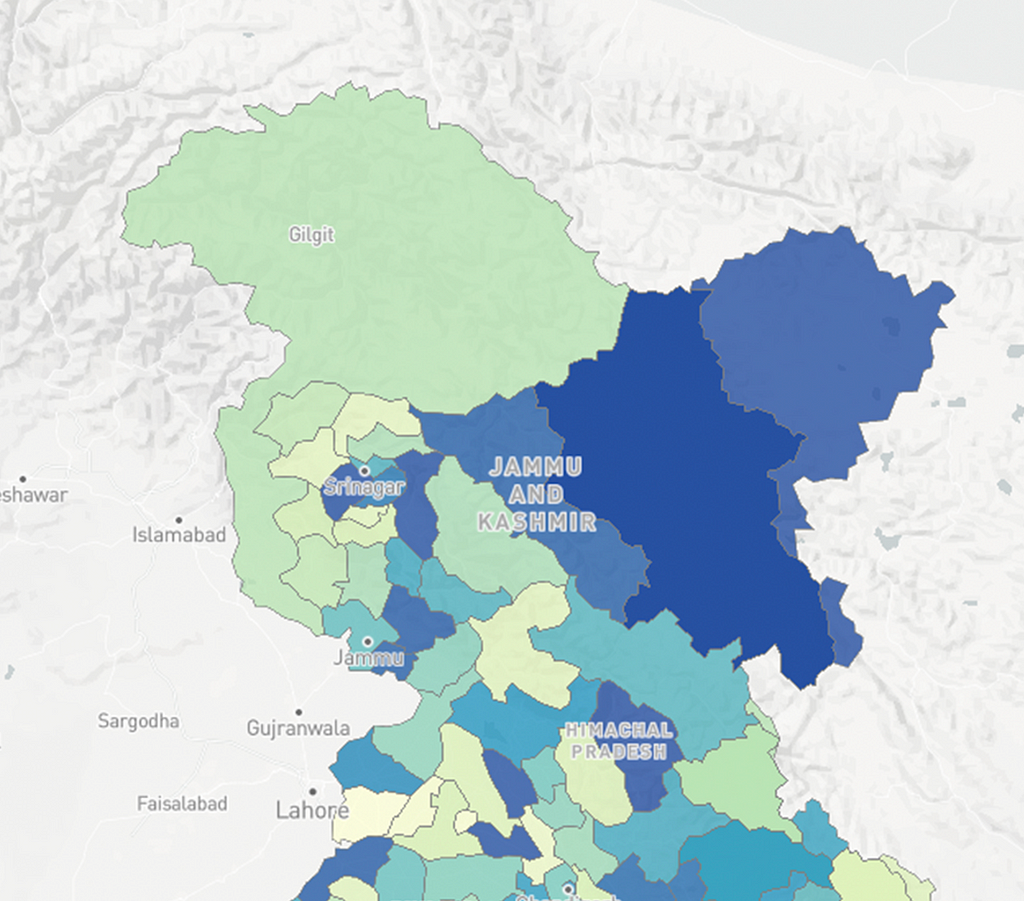
- Support for localized worldviews: Borders in certain countries may be ambiguous or outright disputed. That’s why we’re giving you full control over which worldview you show specific users. Use runtime styling to alter the map’s worldview on the fly by matching your map labels to a default language or device location as your users move across global boundaries.


- Expertly detailed: Our polygons are incredibly detailed and precisely edge-matched by our cartography team. All boundaries within a hierarchy matched precisely to their parent polygons for pixel-perfect map visualizations that help your customers understand their data.
- Fast maps: As always, we serve boundaries on vector tiles, so they quickly visualize your data at any level of detail on our web, mobile, or desktop SDKs. Zooming through data is smooth even with thousands of polygons, giving your customers the ability to interact with their data in new ways.
Explore our product page to find out more. Or if you ready to get started mapping with Enterprise Boundaries, reach out to our team.

Drill-down into your data at any level with Mapbox Enterprise Boundaries was originally published in Points of interest on Medium, where people are continuing the conversation by highlighting and responding to this story.