Last year we introduced expressions in GL JS to allow more powerful and sophisticated operations when using your data to style map features — that is, data-driven styling. Today we’re announcing that expressions are available in both Studio and our Maps SDKs for mobile. Expressions unlock new visualization techniques like unit conversion and language fallbacks and make Studio’s data and zoom styling tools more flexible.

Advanced tools for design
We’ve spent the past year rethinking the map styling experience to give users more power and control. You may want to add custom filters to style properties, display data only at or between certain zoom stops, or maybe you want style map features based on very particular conditions — no use case is the same. You can now access the full power of expressions using a visual UI.
Zoom ranges
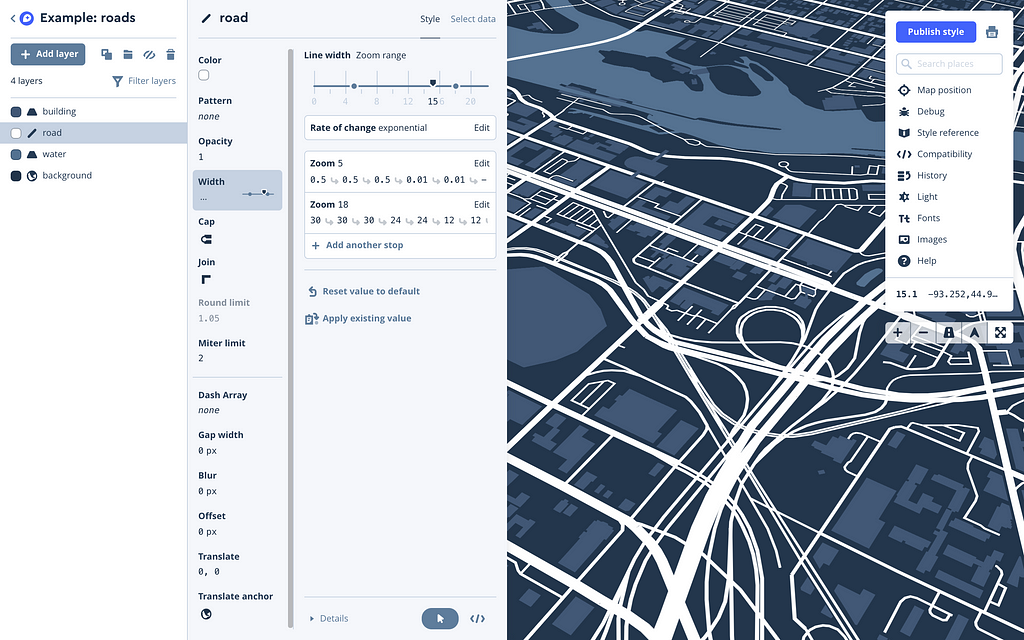
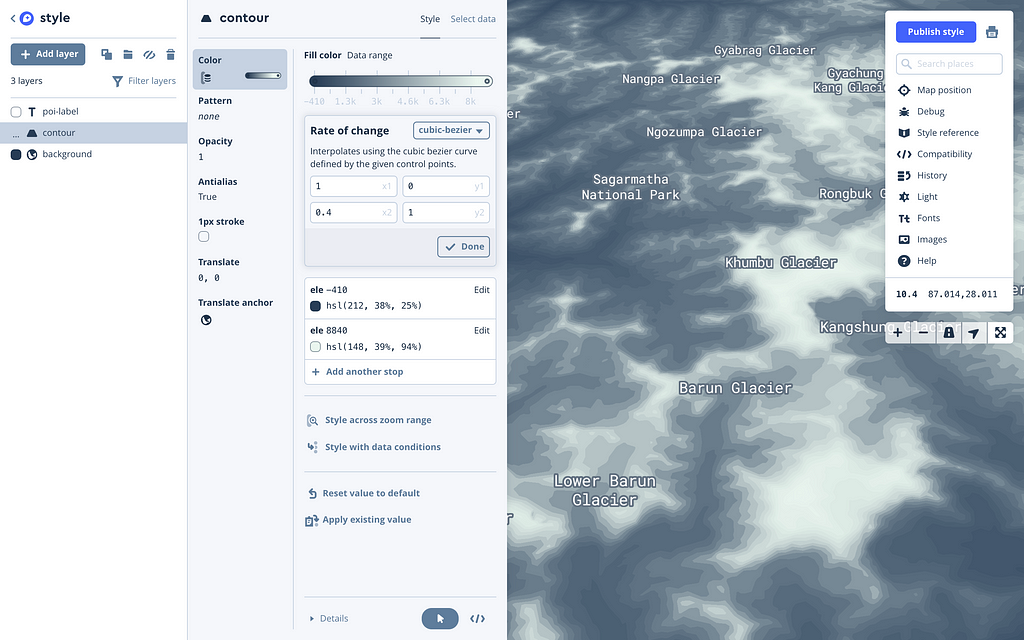
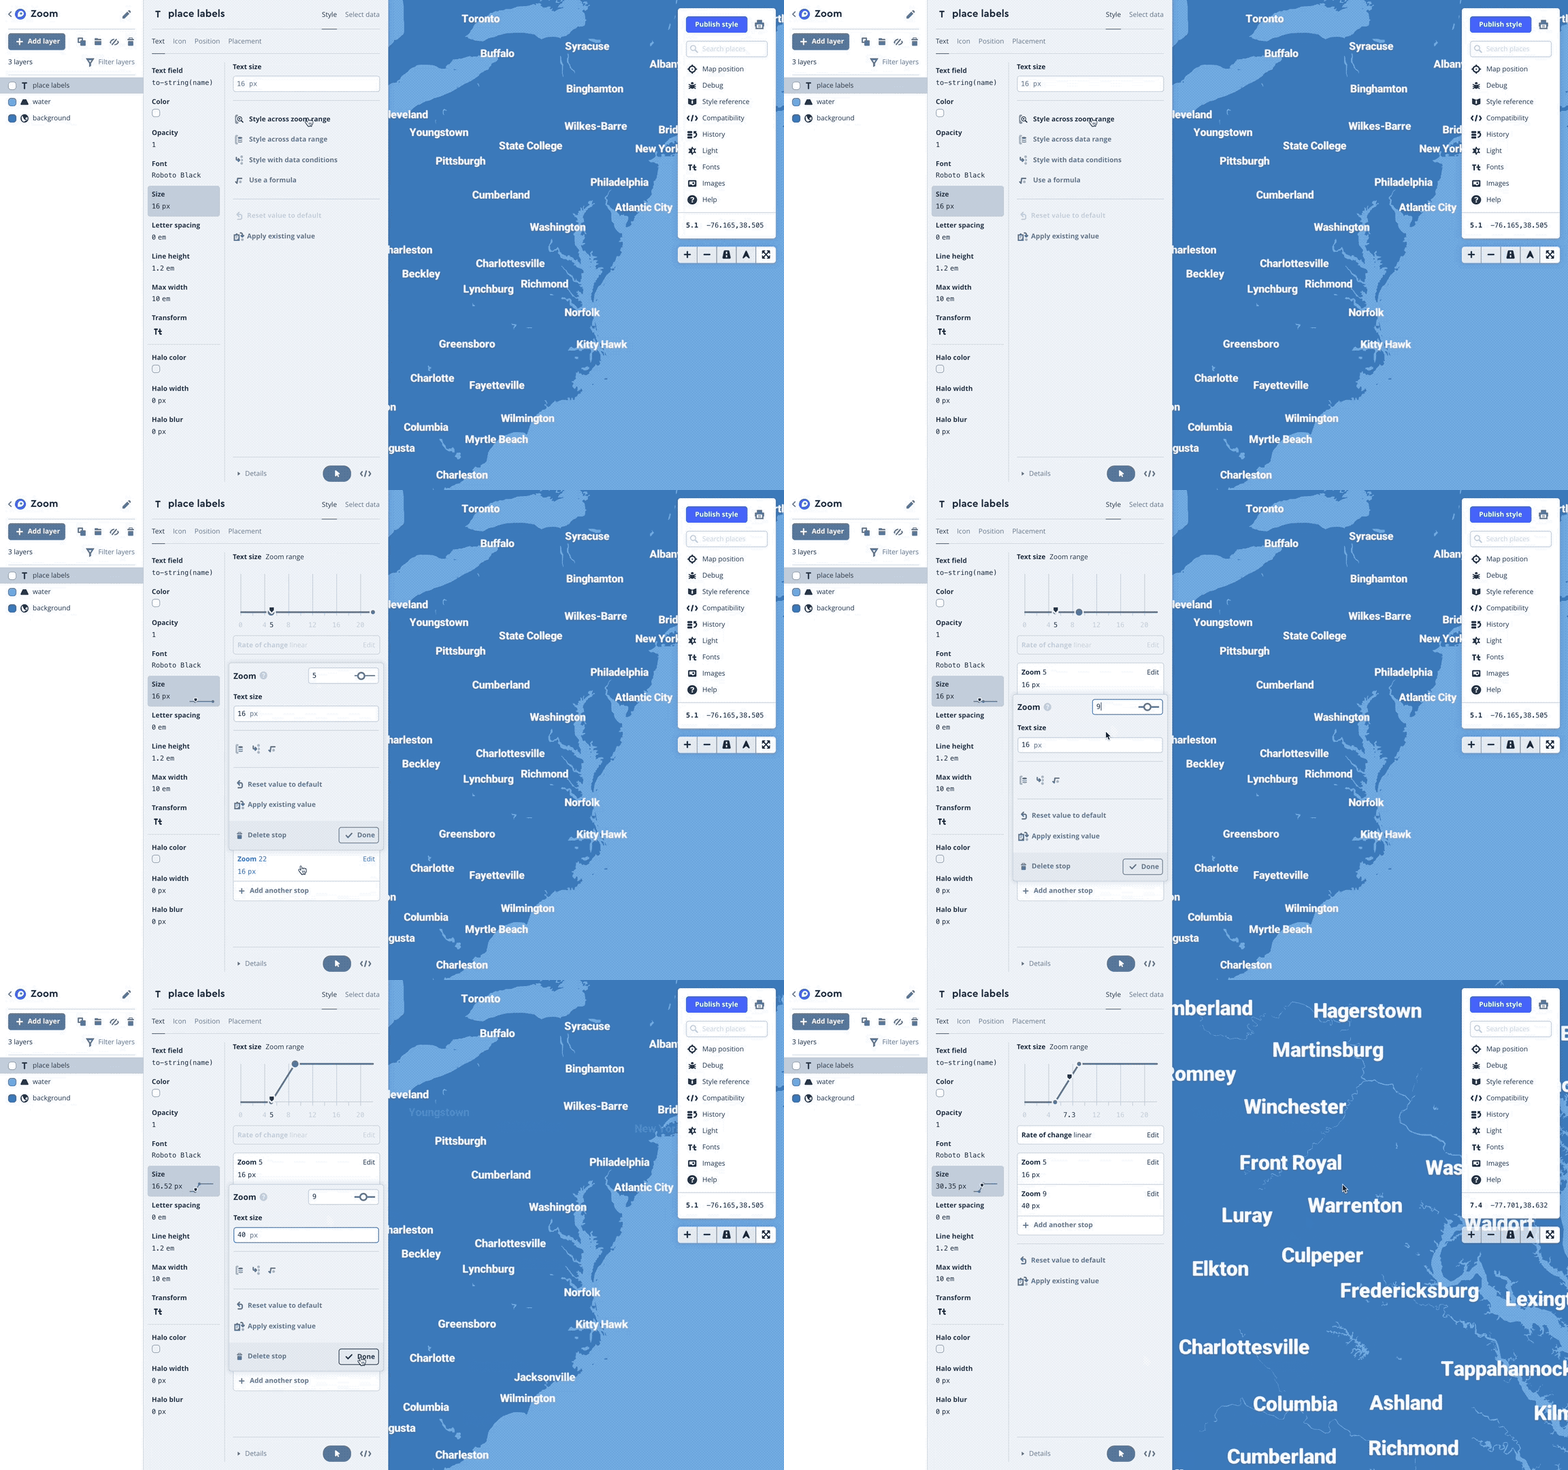
Use zoom ranges to change your map style as the map zooms in and out. You can nest other types of expressions inside zoom ranges, and the UI supports new types of interpolation like cubic Bézier. Here’s how to adjust font size based on zoom, for example:
Data ranges
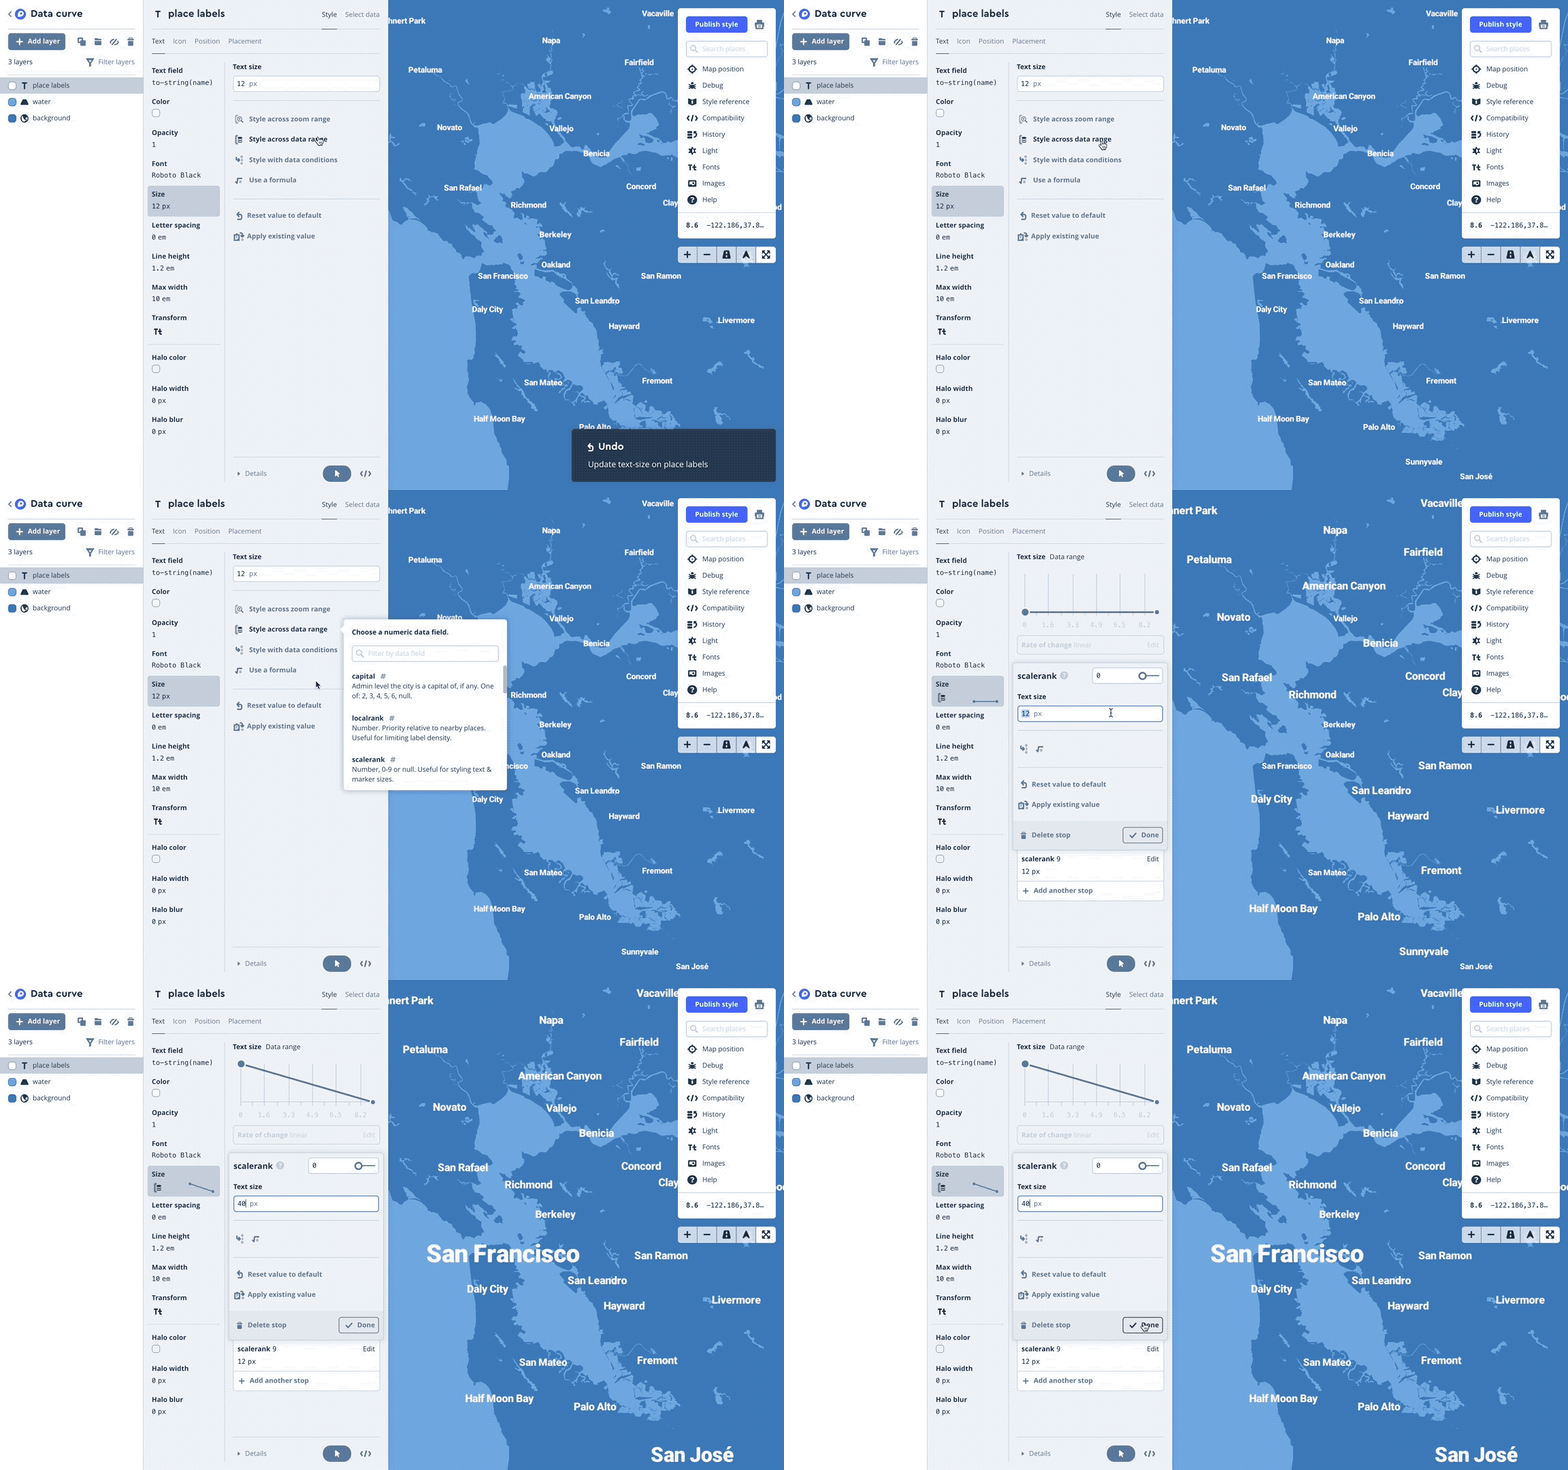
Use data ranges to vary interpolatable values (numbers or colors) across a range based on a data field. Below is a creation of a new data range on the scalerank property. Data ranges are not just great for basemap design; they’re also key for creating data visualizations from continuous data:
Data conditions
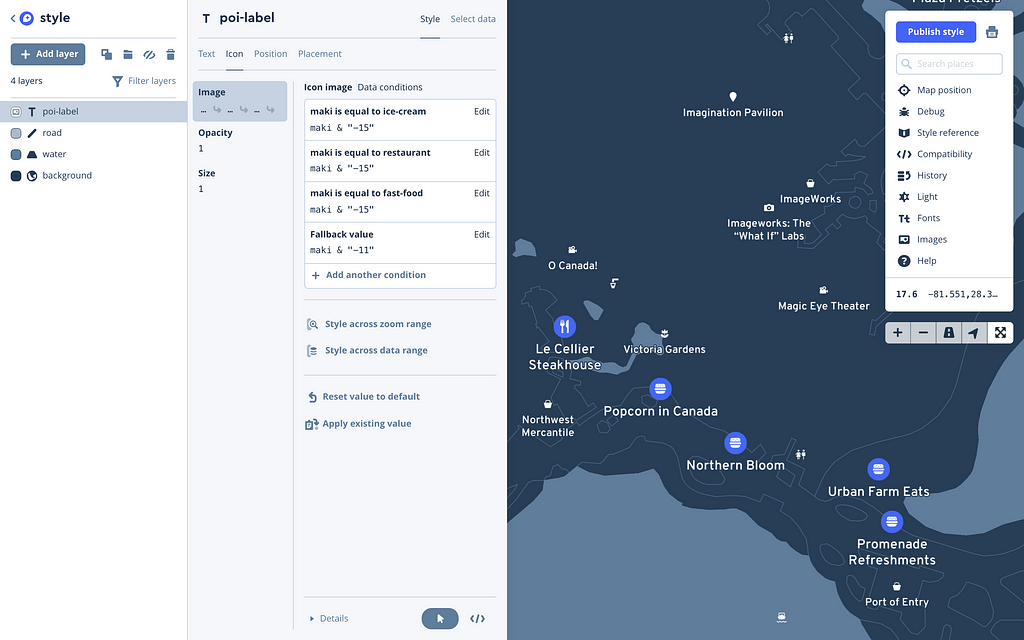
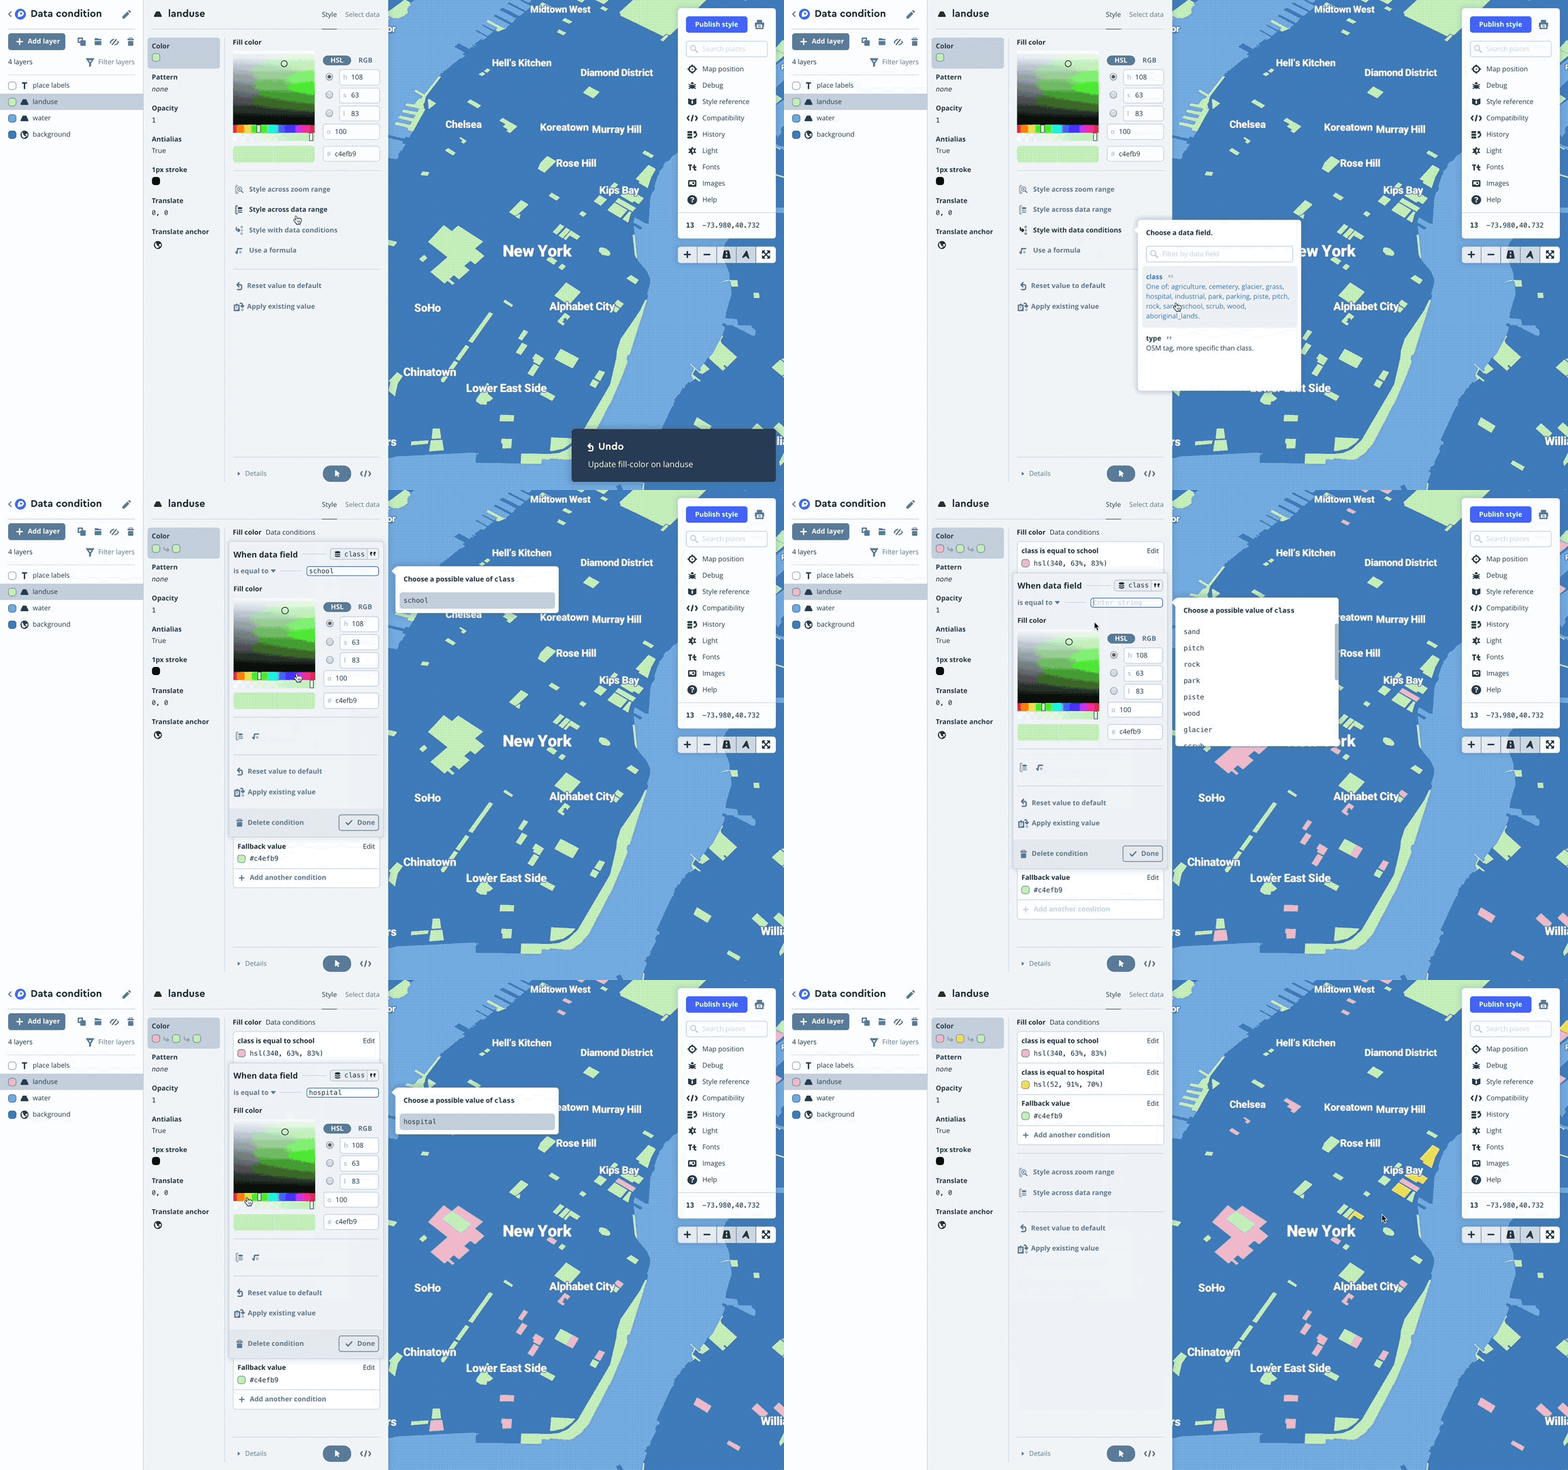
Data conditions let you define logical statements that resolve to true or false, and, if true, apply a particular style. They’re great for styling non-interpolatable data like road classifications or landuse types:
Formulas
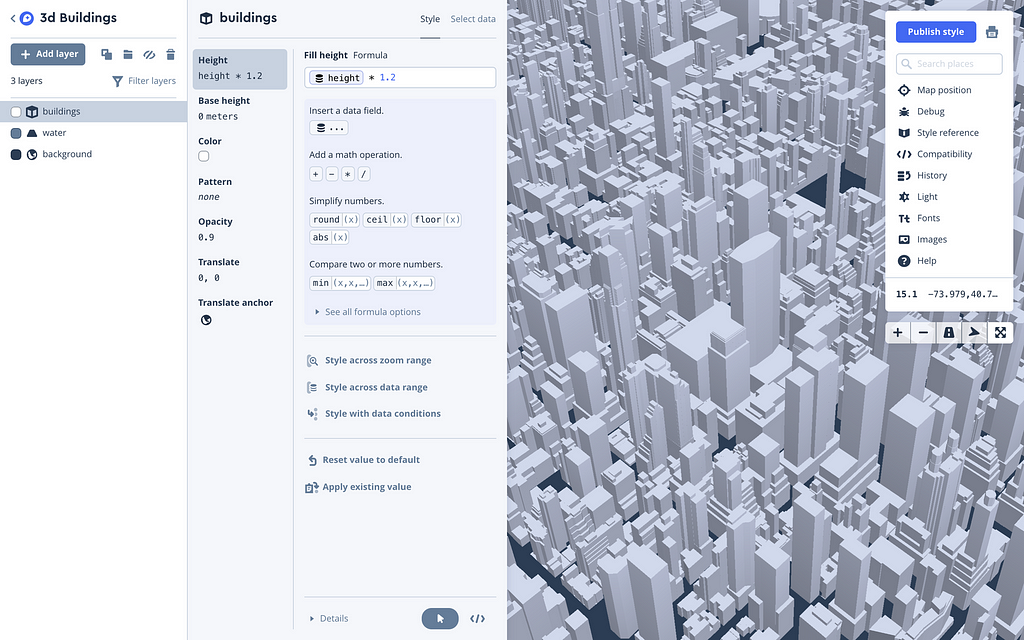
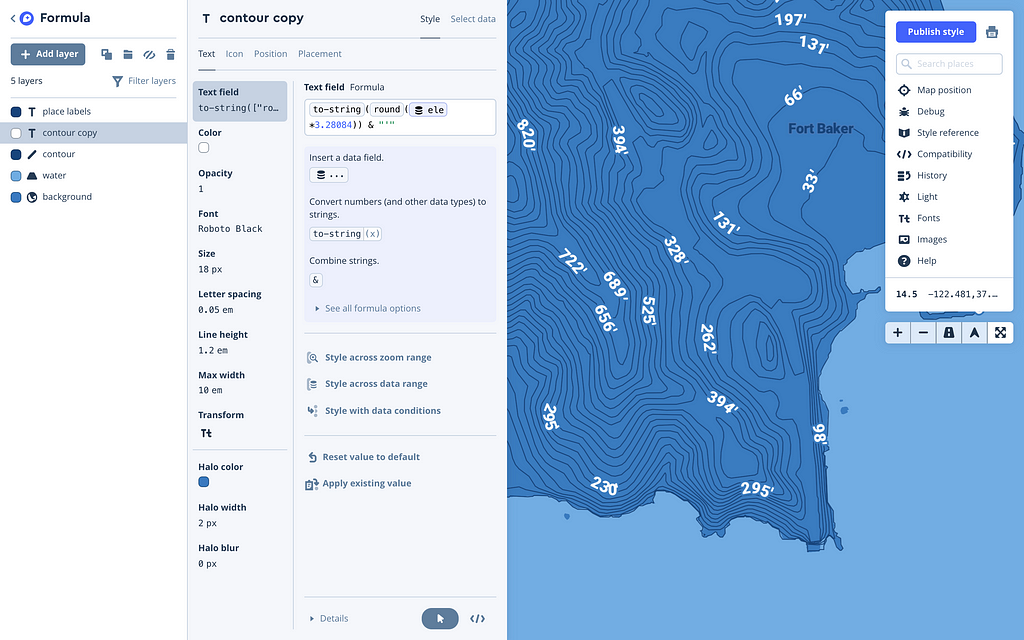
If you need to perform some math, you can now use the formula editor. The formula syntax is similar to what you’d find in spreadsheet programs, with operators ranging from addition to rounding to cosines. For each style property, Studio surfaces a set of suggested expressions, and it includes a full library of expressions with inline documentation. Here’s an example of a formula that converts units in the contour layer of our Terrain tileset:
Nested values
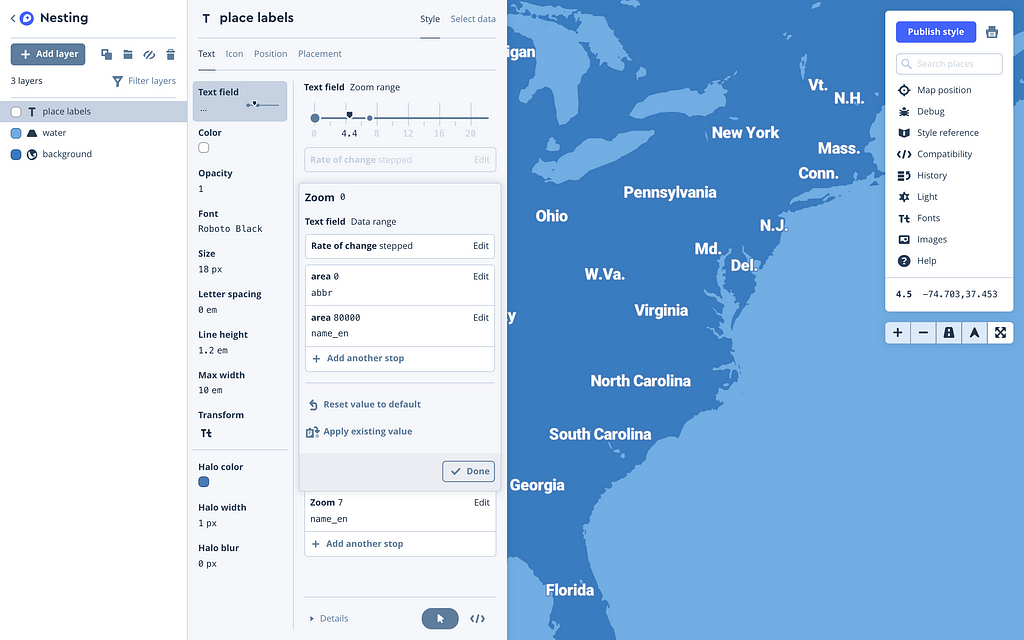
Studio supports nesting for zoom ranges, data ranges, and data conditions, allowing more complex expressions. For example, you can style road widths by class data property and by zoom level. Below is an example of a conditional expression nested within a zoom expression. It’s basically saying, “If zoom level is greater than 5, and area is less than 80,000 square kilometers, display an abbreviated name; otherwise display the full name”:
Works on mobile too
Maps SDK for iOS v4.0 and Maps SDK for Android v6.0 replace style functions with expressions, so all the powerful operations we showed you above also work on mobile platforms. If your existing code takes advantage of runtime styling, check out our guide for migrating to NSExpression on iOS and migrating to expressions on Android. Haven’t used style functions before? We have detailed documentation on using expressions on iOS and Android.
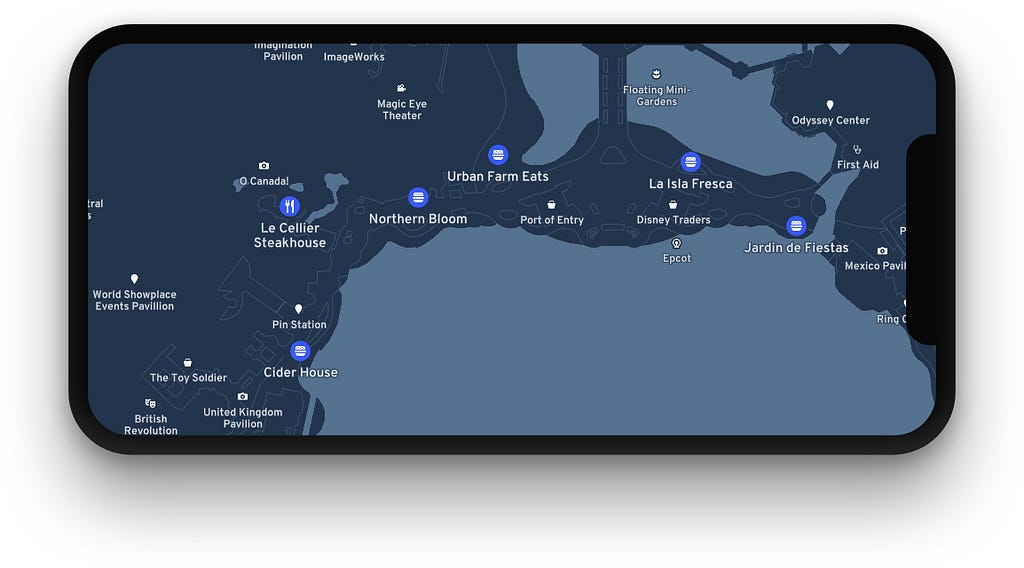
All the Studio examples in this post are possible with runtime styling in our mobile SDKs. Here’s how you’d implement the above icon styling technique on iOS:
poiLayer.iconImageName = NSExpression(format: "mgl_join({maki, TERNARY(maki IN {'ice_cream', 'restaurant', 'fast-food'}, '-15', '-11')})")Get started with expressions
Create a Studio account and start using expressions to style the map in creative ways. See the Studio Manual for documentation, and download the latest version of our Maps SDKs for mobile to use the power of expressions in your mobile apps.
These tools will enable designers to do things we’ve never seen before, share your projects and tag #BuiltWithMapbox. We’d love the feedback.
More powerful styling in Studio was originally published in Points of interest on Medium, where people are continuing the conversation by highlighting and responding to this story.