A guest post by Anya A’Hearn
Tableau users love adding Mapbox background maps in Tableau to really enhance their data visualizations and dashboards. You can upload your own geographic data to provide the right context in your viz, style any element of the map- color, font, zoom-dependent visibility, etc. easily in Mapbox Studio. Choose between building something artistic or stylizing a map to match your brand, and add additional detail in the map with layers for building footprints, places of interest, and terrain — just to name a few! Predefined styles make adding topographic or imagery-based background maps one-click easy, and Mapbox has many great templates to start from.
For many traditional Business Intelligence users, delving into the world of cartography and geospatial analytics is unknown territory and it’s hard to know how to get started. When I first wanted to learn to use Mapbox, I discovered the welcoming Mapbox community via Maptime Meetups. Tableau already has such a vibrant and supportive community. As the head of the #SFBATUG (San Francisco, Bay Area Tableau User Group), I wanted to get these two great communities together.
At a Tableau User Group meeting at the Mapbox headquarters in downtown San Francisco, we provided hands on training for the many ways Mapbox and Tableau can be used together to create an interactive, location intelligent, analytic data solution.
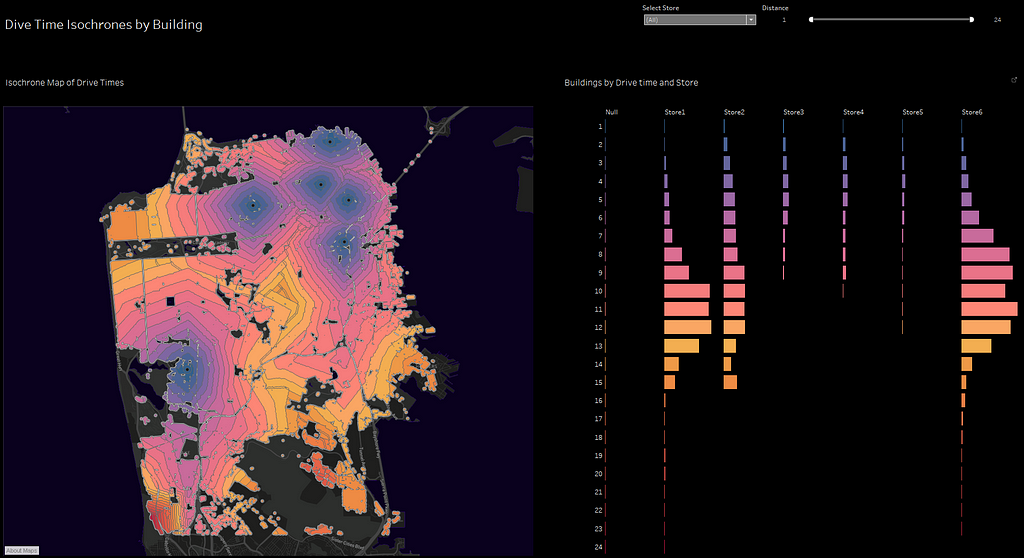
We started with the use case of a local grocery store wanting to offer delivery service to its customers in San Francisco. The goal was to derive service areas based on drive time isochrones using the Mapbox APIs, and visualize potential customer volume each store and other customer and store analytics in Tableau.
Over the course of 90 minutes, we walked through building the location intelligent application. First we created a new style in Mapbox Studio to match the branding of the store including custom colors, fonts. Geospatial context was also added to the background layer analysis by adding and styling custom geographic data for store locations and SF neighborhoods. Road networks were styled to be more prominent and pop the service routes more prominently into the story.
After importing the customized background map into Tableau, the talk moved to using Mapbox’s APIs to level up your data storytelling. To enhance our Tableau viz, we added features like drive time analysis, 3D maps, and on-demand directions that could interact back and forth between the Tableau and Mapbox UI. San Francisco buildings were colored by isochrone drive time to specified store delivery trade areas, and an interactive dashboard was created to allow both store and customer specific analysis.
Taking it even further, we added the ability to select a customer location and see detailed delivery time estimates as well as driving directions to the analysis.

After running through the data viz tutorial in Mapbox and Tableau, Ryan showed how to drill down into each store to see the driving route a potential customer would take to get to each store using the Directions API with our Tableau dashboard.
By the end, we created a location intelligent, web based, analytic tool using Tableau and Mapbox side-by-side to leverage the advantages of each platform:
Tableau
1. Make powerful dashboards, fast.
2. Easily connect to data in a spreadsheet, database, or API.
3. Easily share your data visualizations without any code.
Mapbox
1. Customize maps with any location data and style.
2. Add context to your map with traffic, isochrones, navigation, and more.
3. Add Mapbox maps and tools natively in Tableau dashboards.
If you need help getting up and running using Tableau and Mapbox, here are some great resources:
Set up a free Mapbox account
Mapbox Studio Manual
Using Mapbox maps in Tableau
SFBATUG Materials for Hands-on Training
Join the #SFBATUG
Join Maptime SF/OAK
Consulting Support via DataBlick
About the Author:
Anya A’Hearn is the founder and Principal at DataBlick, a boutique consulting firm that transforms your data into actionable art. DataBlick wrangles data, wraps people’s brains around complex math, and makes the result stunning. DataBlick has worked with various Fortune 500 companies to help integrate Mapbox and Tableau.
Leveraging Mapbox for location-intelligent analytics in Tableau was originally published in Points of interest on Medium, where people are continuing the conversation by highlighting and responding to this story.