By: Chelsea Goddard

Originally created by Vladimir Agafonkin (who’s been a part of the Mapbox family for almost four years), Leaflet is an entirely open JavaScript API used to make interactive maps. Built for and with the open source community — including current maintainers Iván Sánchez Ortega, Per Liedman, and Yohan Boniface — Leaflet can easily integrate with Mapbox, support GeoJSON overlays, as well as nearly any other data source your mapping-heart desires. Mapbox.js, for example, is built on top of Leaflet and is our plug-in to easily integrate your Mapbox maps with Leaflet.
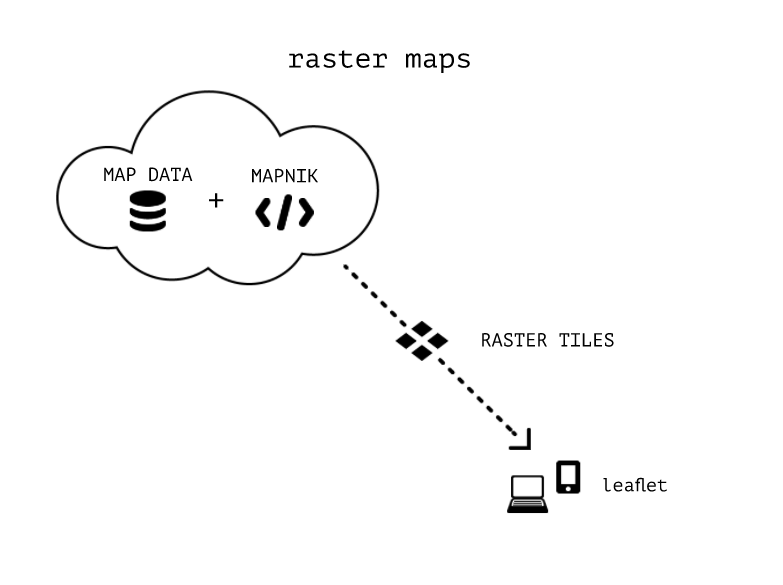
The main map for Leaflet is made of raster tiles. These tiles can come from a service like mapbox.com, which automatically supports legacy raster tiles, or they may come from a custom tile server. Raster tiles are excellent for imagery or representing continuous data, like terrain, and because the tiles are generated on the server they are static. Sequentially, Leaflet runs in the browser and turns image tiles into a beautiful interactive map.
Limitations of raster tiles
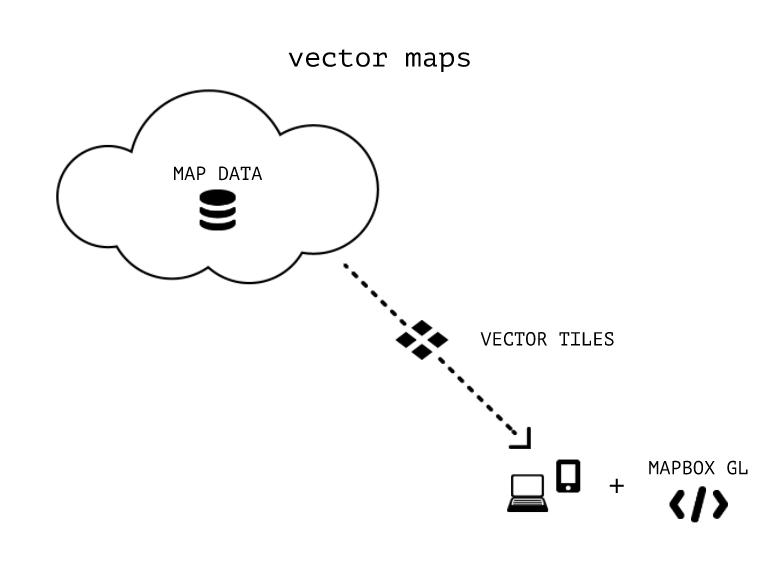
The limitations of raster tiles become apparent for users who are interested in creating a dynamic web mapping experience — particularly those visualizing data. This is what led us to invest in vector tiles and Mapbox GL, an open source project comprised of Mapbox GL JS, a rendering engine for web browsers, and Mapbox GL Native, which renders on native clients. Like other OpenGL libraries, Mapbox GL interacts with your client’s GPU under the hood for enhanced rendering capabilities and our GL team is super excited about the possibilities presented by hardware-accelerated rendering. Check out one of my favorite demos that shows off how to toggle between 2D and 3D extrusions for data visualization.
We’re constantly pushing the boundaries of how much data you can display on a map while keeping them fast and performant across platforms and devices. Advances in browser support for the Web GL standard, along with native GL support on mobile devices, allowed us to make the jump to vector tiles. Vector tiles define what’s possible for web and mobile maps while opening up entirely new possibilities for data visualization and real-time navigation.
Vector tiles vs raster tiles
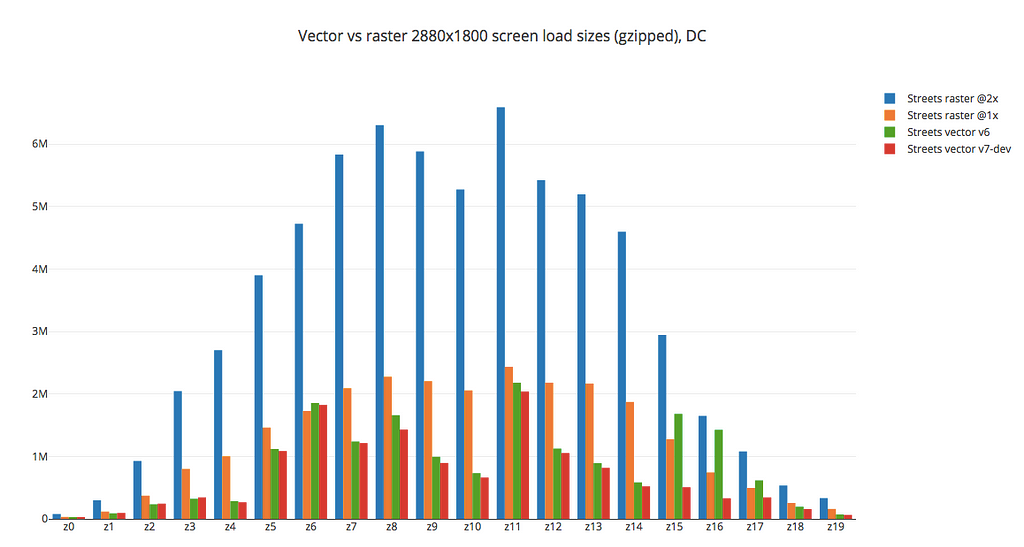
Generally, we bucket maps into one of two categories: Raster or Vector. This becomes especially interesting when we start to talk about how other web mapping tools draw data. Vector tiles, for example, are usually 20–50 percent smaller than a comparable raster tile; or 1 vector tile to every 4 raster tiles. In contrast to the raster tiles used by Leaflet, vector tiles contain raw map data in a binary format. This allows for a couple of important differences: smaller tile packages that allow for less bandwidth (a performance booster when streaming to devices) and map styles can be changed on the fly!


The difference in load sizes between vector and raster screen load times is evident in this chart made by Vlad in 2015, or you can see it in the demonstration by Lauren below.

When to use Leaflet v Mapbox GL
If you have raster tiles and need support for Leaflet’s core features or plugins, Mapbox maps work in Leaflet and with Mapbox.js. For cases where you need dynamic maps with support for fast client-side restyling, Mapbox GL is amazing. So, the next time you have a project where you want to use Mapbox GL or Mapbox.js without Mapbox tiles or Leaflet with Mapbox tiles well, as Young MC once said, “if you want it, baby, you got it.”
And both are open source. Over the years, we’ve built Mapbox maps on several open source libraries. Throughout each iteration of our mapping stack, we’ve stayed rooted in open source development. This is what makes it possible to use Mapbox maps in a variety of libraries, like Mapbox GL JS and Leaflet, while other mapping providers lock you into their proprietary code. It’s also why our vector tile spec supports custom data and not just the map layers we provide.
You can contribute to Leaflet and Mapbox on GitHub at any time. If you want to find out more or have any questions, hit me up on LinkedIn — I’d love to talk!
Mapbox ❤️ Leaflet was originally published in Points of interest on Medium, where people are continuing the conversation by highlighting and responding to this story.