Quantcast
Channel: maps for developers - Medium
Viewing all 2230 articles
Browse latest View live

Simple, Fast Map Data Editing

$
0
0

We are trying to make it easier to draw, change, and publish maps. Some of the most important geospatial data is the information we know, observe, and can draw on a napkin. This is the kind of data that we also like to collaborate on, like collecting bars that have free wifi or favorite running routes.

geojson.io aims to fix that. It's an an open source project built with MapBox.js, GitHub's powerful new Gist and GeoJSON features, and an array of microlibraries that power import, export, editing, and lots more.

The project is moving and improving fast - you can get in on the development process on GitHub and we'd love to hear feedback after you kick the tires. Stay tuned.


We Are Growing

$
0
0

We just launched /jobs @MapBox. We're growing fast and looking for talented, hungry people to join the team. Check out the openings or just drop us a line at jobs@mapbox.com to tell us how you could fit in.

A Better OpenStreetMap.org, One Step at a Time

$
0
0

For the past month, we've had our heads down on a series of incremental improvements to OpenStreetMap.org. This included a new sign up workflow, an improved map UI, a new data export screen and a full-featured 1.1 version of iD. Our goal for each one of those was to tighten the overall impression of the site and improve the experience for new contributors.

Saman presented at State of the Map US a sweeping vision for a ground-up redesign of OpenStreetMap.org, which got people fired up about thinking and talking about what the site could be. To match the pace of the project and find out early what works and what doesn’t, we have been taking an incremental approach to implementation, focusing on bite-sized improvements with big impact.

Here is an overview of the changes that were rolled out on OpenStreetMap.org and what is still to come.

Rolled Out

Form clean up. We replaced table-based layouts with CSS and introduced a common clean design, consistent margins and custom buttons to forms across the site. This instantly improved the impression of many screens on OpenStreetMap: sign up forms, comment forms, user settings, messaging UI and more.

New map controls. Over time, map controls like zoomers, layer switchers, and map key grew into a clutter surrounding the front page map. This change consolidated map controls into a single UI on the top right of the map, clarifing map interaction and freeing up valuable real estate on the screen.

Redesigned share/export UIs. Map permalinks, HTML embed, and image export features can be all found now within the "Share" panel of the new map UI. Before, this functionality was part of the data export panel. We've also added the often-requested ability to share links which include a marker.

image

With space freed up in the Export sidebar, we've added information about sources for OpenStreetMap bulk data - making data export functionality easier to find.

Hash-based permalinks. OpenStreetMap.org's URL now tracks the location of the map constantly with leaflet-hash. This means you can easily bookmark your location, and share it simply by copying the URL from the address bar.

iD 1.1. The iD 1.1 release brought important improvements that will allow it to replace the aging Potlatch 2 as the default web editor on OpenStreetMap. Specifically, 1.1 brings crucial performance improvements on Firefox and relation editing support, making it a full fledged editor for a broad audience.

Coming Soon

Improved sign up flow. This is a complete design review of the OpenStreetMap sign up process with the goal to create a more guided experience for new users. The account creation, contributor agreement, and confirmation pages have been redesigned and feature an adorable anthropomorphic globe by Saman.

The outdated and verbose welcome email was pared down to a single confirmation link. Once confirmed, the user lands on a welcome page that explains the basics of OpenStreetMap and encourages them to dive in and get started mapping. The starting point on the map is based on the HTML5 geolocation by default, but it can be also derived from location parameters from the referring URL. So, for example, Foursquare's "Edit OSM" button can link directly to a specific location on the map, and the sign up workflow will guide users smoothly through account creation and eventually place them at the expected location, ready to edit.

User menu. By replacing the list of links in the top left with a compact drop down menu, we can provide more functionality in a smaller, nicer looking package.

Still to Come

Next on our radar are a help landing page, a consolidation of the main page sidebar, and improvements to the site's responsiveness on mobile devices. Many of the changes build on each other, and all are designed to improve the onboarding experience and the overall impression of the site.

Between here and the upcoming State of the Map conference in Birmingham, UK we are going to be focused on these iterative improvements. We're looking forward to picking up a larger conversation about a vision for OpenStreetMap.org at the State of the Map - don't miss it!

Cloudless Landsat Preview | Vancouver

$
0
0

We’re working on the next release of Cloudless Atlas, processing thousands upon thousands of huge Landsat scenes. Many techniques carry over smoothly from our cloudless MODIS project, but the number of pixels is on another level entirely – on the order of 20 trillion. We’re planning for a cluster of 400 servers just to manage the petabytes of data downloads. The main pipeline, though: that will be a cloud unto itself, with just over 1000 high-end machines, each applying our tuned processing kernels to millions of pixels per second. It’s been fun crunching the numbers to get this set up, but the best part is seeing the beautiful images we can produce:

Here’s the famously lovely city of Vancouver, Canada. It’s built on the delta of the Fraser river, which carries pale sand produced by the scouring of glaciers far inland. Just north of the city are the mountains that hosted the 2010 Winter Olympics; to the south are fertile valleys and the border with Washington State. (In fact, the peninsula in the lower left is the American town of Point Roberts, cut off from the US mainland.)

I’ve been looking at a lot of images like this one lately, adjusting various parameters. They’re the very first sample swatches for the cloudless Landsat project – areas carefully chosen to be tricky because of seasonal vegetation, mountains, clouds (having grown up just outside this image’s frame, I can assure you there are plenty of clouds here), different kinds of water, agriculture, and so on. Making basemaps is an exercise in balance.

London Happy Hour at Strongroom

$
0
0

We'll soon be on our way to State of the Map in Birmingham UK. Join us at our stop in London for a happy hour at Strongroom in Shoreditch on Wednesday September 4th to talk maps, satellite imagery and OpenStreetMap over a beer. We're there from 6PM on.

FirstLook for MapBox Satellite Live

$
0
0

We are getting closer to launching MapBox Satellite Live! Over the past month we focused on our pipeline's integration with DigitalGlobe's FirstLook imagery service. FirstLook is a custom monitoring service available through DigitalGlobe - the largest satellite company in the world - which will capture protests, monitor wild fires, and be the first to see post-disaster damage.

(Testing image: Cairo, Egypt: July 23 2013, 7:49:20 AM -- Pan Sharpened Natural Color via QuickBird. Street data via OpenStreetMap)

As you can see, the imagery quality looks amazing. But the most amazing thing about this image is what you can't see: just how quickly we made it. Our automated pipeline constantly monitors DigitalGlobe's FirstLook feeds, and in under 30 minutes every new scene that comes off the satellites as part of the FirstLook service is added to our MapBox cloud. We process and refine each scene to produce wicked fast web map layers, just like those you render from TileMill. When we formally launch all you will see is an "add this map" button, letting you add the map right to your MapBox account.

DigitalGlobe's FirstLook imagery service will be part of the MapBox Satellite Live premium content offering and will be available to all of our media subscribers as part of a new package that Dave is working on. Ping @dhcole on twitter if you want to talk more about the new media package or sign up for beta access to MapBox Satellite Live.

User-Friendly Guided Feature Extraction: Extending the iD Editor

$
0
0

We want to make it easy to extract features from precise, current satellite imagery and add them to your map in iD. Feature extraction has been a topic in GIS for decades, but has never been intuitive enough to empower collaborative efforts like OpenStreetMap.

So we're working on a simplified, smarter interface that makes extraction as easy as the lasso tool in Photoshop. It works as a plugin for the iD editor, and will also be reusable for other projects.

What's New in TIGER 2013

$
0
0

On Thursday, the US Census Bureau released the 2013 version of TIGER, its base map of the United States. Here is a first rendering of the new TIGER 2013 dataset. Changes in the 2013 edition are in yellow, changes between 2010 and 2012 are in cyan, changes made in the accuracy improvement push between 2006 and 2010 are in magenta, and data that hasn't changed since 2006 is in blue.

Most of the United States data in OpenStreetMap was originally imported from TIGER before being corrected and extended by thousands of mappers, so watching for changes to TIGER is a great way to find additional opportunities to improve OpenStreetMap.

The biggest changes in this version are additional detail about freeways in cities like New York, Boston, Baltimore, and Minneapolis, improvements that have already been made independently in OpenStreetMap. The more interesting changes from an OpenStreetMap perspective are to mountain roads that were previously badly aligned, small towns like Igiugig, Alaska that were barely on the map before, and areas of new development that haven't all made it onto the map yet.


Open Source Mapping in Ramallah

$
0
0

Today I've arrived in the city of Ramallah to connect with technologists, civic activists, and students at TechCamp Ramallah. The TechCamp kicks off tomorrow and will bring together organizations from across the West Bank and Israel to discuss implementing technology in the challenges they face. I'll be leading sessions on TileMill, MapBox, and OpenStreetMap.

Open-source technologies are leading the way in providing organizations access to tools and data for powering their work or advocating their message. With the latest work on geojson.io and MapBox Satellite, I'm excited to talk about the art of the possible.

Newseum Launches Civil Rights Map

$
0
0

The Newseum has started using MapBox in its Digital Classroom. Coinciding with the 50th Anniversary of the March on Washington, they've combined maps and markers with their amazing archive of newspapers to showcase the Civil Rights Movement through the 1950s and '60s.

Note: A free Newseum account is necessary to view the content

The World’s Highest Resolution Map of Global Temperature from Forecast.io

$
0
0

Check out the heat of daylight sweep across the Sahara in this animation of the world's highest resolution temperature data from Forecast.io. Or zoom in to see the microclimates across the San Francisco Bay, which can vary as much as 10 degrees Fahrenheit in just a few miles.

Working with the new Project Quicksilver dataset and the team at Forecast.io has been incredible. They're pushing the boundaries of weather data and presentation in exciting ways. Along with MapBox Live satellite imagery, we're planning to offer weather data like this ready to go on MapBox Maps. If you're interested in weather data or other ways we can help journalists and media organizations tell stories with maps, find me on Twitter: @dhcole.

Off to Europe: Let's Catch Up in London, Birmingham, Paris, Berlin

$
0
0

GPS tracks on OpenStreetMap by Eric Fischer

We're getting on our way to Europe today, making stops in London, Birmingham, Berlin, and Paris. Looking forward to catching up with a ton of folks at one or more of these occasions:

Get in touch ahead of time and drop us a line on Twitter: @willwhitedc, @jfire, @ericg, @samanbb, @mapnik, @kkaefer, @lxbarth, @hrwgc will be on the road.

Facebook Rival VK Goes MapBox

$
0
0

VK, second largest social network in Europe, switched to MapBox maps September 1st. Its 47 million daily users now see their stories, photos and messages all mapped on MapBox maps. The switch from their previous map provider was fast, with the actual engineering work not taking more a few lines of code.

VK uses MapBox maps for large slippy popout maps like in this example of a locator map for a post:

This is the interface for attaching a map to a post on VK:

VK instantly adds a vast number of new OpenStreetMap data consumers, incentivizing a new audience to not only consume OpenStreetMap data but also to improve it. This is especially exciting in VK's case, as its core countries already have very active OpenStreetMap communities.

Berlin Happy Hour at Pratergarten

$
0
0

On our tour through Europe Eric and myself will join Konstantin for a couple of days working out of Berlin. Let's meet up to chat maps, satellite imagery and OpenStreetMap over a beer at Pratergarten on Tuesday September 17th - we'll be there from 6PM on!

Illustration: Eleanor Lutz.

Vote for Our Session at SXSW: Only One Day Left!

$
0
0

Vote for our mapping session @SXSW! - there is only 1 day left for voting! We are teaming up with our friends at Gnip, who we partnered with to map 3 billion tweets. Eric @MapBox and Ian @Gnip will show off the maps that Tom and Eric Fischer designed and talk about the future of mapping big data, how to extract analytics from twitter and other social media, and why fast mapping tech matters. All of this is going to focus on our open source mapping stack.

Vote now!

Beyond Dots on a Map: The Future of Mapping Tweets

What can 3 billion geotagged Tweets collected over 18 months tell us? Turns out, a lot. Gnip collaborated with the team at Mapbox to study 3 billion geotagged Tweets in aggregate and visualize the results. That work led to 3 maps showing iOS vs Android usage, where tourists vs. local hang out, and language usage patterns. From just these maps there were some surprising findings revealing demographic, cultural and social patterns down to city level detail, across the entire world. For instance in the US, Tweets from iOS showed where the wealthy live (http://bit.ly/iOS-maps). The data has many other stories to tell as well.

As Twitter use becomes more ubiquitous, it’s increasingly serving as a valid proxy not just for what’s happening “on social media,” but for what’s happening in the world in general. This is the first time social data has been mapped at this scale, and we’ll talk about both lessons gleaned from the data and what we learned about making this big of a visualizations.

See more on the @SXSW PanelPicker


World Satellite Business Week

$
0
0

We are heading to Paris today for World Satellite Business Week, an international conference bringing together more than 600 senior-level executives and government representatives from the global satellite communications and information business industry.

We're looking forward to having meetings and talking about how our platform can help power content providers in the industry. If you're in Paris contact me at chris (at) mapbox.com or @hrwgc on twitter to talk shop.

We are heading to Paris today for World Satellite Business Week, an international conference bringing together more than 600 senior-level executives and government representatives from the global satellite communications and information business industry.

Skyline by baraa_kell on Flickr

We're constantly making iterative improvements to our global imagery mosaic, MapBox Satellite, and upcoming Satellite Live near-realtime imagery service.

We're looking forward to having meetings and talking about how our platform can help power content providers in the industry. If you're in Paris contact me at chris (at) mapbox.com or @hrwgc on twitter to talk shop.

Visualizing Building Age in the Netherlands

$
0
0

All 9,866,539 buildings in the Netherlands were mapped and shaded according to their year of construction in the map above. The map was created by Bert Spaan using TileMill, similar to the Portland and NYC building maps, and completely done with open data (an alternative, easier place to download the data). Give TileMill a try and let us know what you make!

OpenStreetMap's Contributor Community Visualized - Individual by Individual

$
0
0

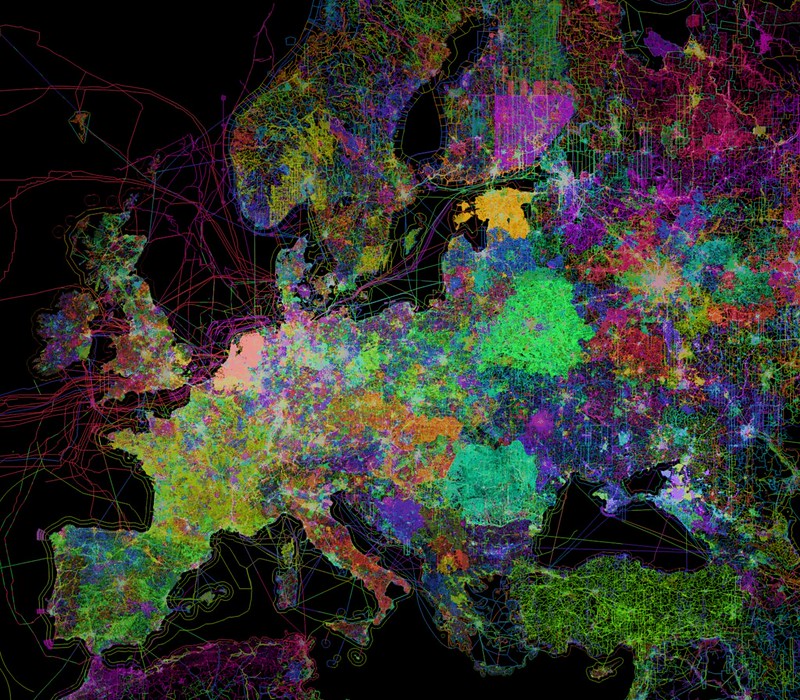
OpenStreetMap is created every day by thousands of users logging in and improving the map. Here is a visualization of this amazing social fabric of individuals working together. We generated a color for each road segment from the user ID of the mapper who last edited it to show how many individual contributions large and small add up to a collaborative map of the world. Take a look at how many people have been mapping near you.

Europe

This is OpenStreetMap colored by contributor in Europe.

London

Cities like London show a complex pattern of contributions.

United States

In North America, dense areas where the map has been refined by many people contrast with rural expanses of imported map data.

North America's Atlantic coast

North America's Atlantic coast. You can see how neatly mapping activity often splits along borders.

Here's the full interactive map.

Add MapBox to iOS 7 with One Line of Code

$
0
0

You can now add totally custom MapBox maps to any iOS 7 app in one line of code using our new MBXMapKit, which leverages new changes in Apple's MapKit software to allow greater customization on both iOS and OS X. This video says it all:

Bring your own tiles across the board

Apple's new changes have two parts:

  1. Bring custom map tiles into Apple's MapKit while turning off Apple's maps
  2. Use the same code across both iOS and OS X

Apple's new APIs and, by extension, MBXMapKit, allow you to bring in custom map tiles but also turn off Apple's own maps, allowing developers to leverage Apple's software expertise and ease of integration with a custom look.

Now you can pair Apple's existing maps frameworks with MapBox's completely custom design capabilities — all by changing one line of code in your existing MapKit-using apps.

And because Apple has brought their MapKit to the Mac, the code to integrate custom maps will be almost entirely the same. Rather than using a web-based solution embedded in a web view, developers can now make high-performance native maps without having to learn any new code. Expect to see rapid growth of immersive mapping apps as this starts to roll out worldwide.

You can take any MapBox-hosted map and add it as a fully interactive layer to your iOS or OS X application with the following code:

[someViewaddSubview:[[MBXMapViewalloc]initWithFrame:someView.boundsmapID:@"<user>.<map>"]];

You can continue customizing from there, but the above code produces a fully usable custom map immediately. If you are already using Apple's MKMapView, changing occurrences to MBXMapView is all you need to do to go MapBox.

The future is open

Ever since Apple's MapKit debuted in 2009, developers have been waiting for the opportunity to use Apple's highly-tuned framework along with their own content. Apple has seen the rise of OpenStreetMap and the power of organic, crowdsourced mapping data. Now, developers can write far less code than before by leveraging Apple's frameworks, combining them with MapBox's highly-available, incredibly fast tiles to make completely custom, gorgeous maps.

Watch this space

MBXMapKit is only the start. We will be continuing to add to it and bring great functionality like custom interactivity and vector tile support all in the open just like our existing SDK (which, by the way, we've updated for iOS 7's new look and feel.) For more info, stay tuned to our blog or feel free to reach out to me on Twitter at @incanus77.

Marc Prioleau Joins the Board of Directors

$
0
0

Marc Prioleau, a long time player in the geo space just joined our Board of Directors and is specifically focused to help us grow smart as we continue to expand the team.

Marc Prioleau Joins the MapBox Board of Directors

Marc has been a good friend and advisor, helping us strategize over the last 12 months of rapid team growth as we increased the size of the team by 30% and strengthened our core culture. His geo roots date from the early location days managing marketing for Trimble to VP Marketing and Business Development at deCarta and most recently 4 years working on strategy & M&A in the location market. He can provide perspective on how to quickly scale and how to avoid the pitfalls along the way. Most importantly, Marc gets open source and open data, and sees how these are key strategic advantages for MapBox.

Many folks have probably run into Marc at various geo-events, most recently at the State of the Map US conference in San Francisco. If you haven't met him in person here are two clips of him playing geo-pundit on Bloomberg TV over the last couple of months.

I personally look forward to working with Marc a lot more as we build out more of the team in San Francisco.

Viewing all 2230 articles
Browse latest View live