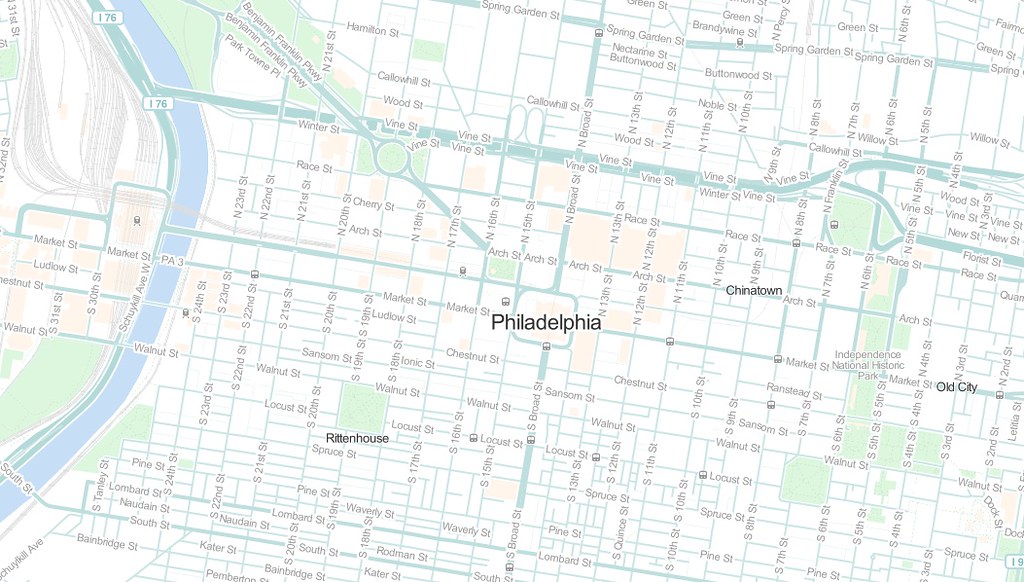
GitHub adds maps! Today’s launch allows any GeoJSON file hosted on GitHub to be rendered as a fully interactive visualization on top of a custom map designed to let the data stand out. Github is taking advantage of MapBox Streets’ new open source vector tiles, perfectly tailored to the company’s visual style, with a color palette that comes from GitHub’s branding and UI colors.

Open by Design
.colorpalette { float:left; min-width:360px; width:100%; height:100px; margin-left:auto; margin-right:auto; padding-bottom:10px; } .colorswatch { height:100px; min-width:44px; width:13%;display: inline-block; } </style>
The basemap is designed to complement, rather than compete with, GeoJSON data layers and leverages the speed and customization of our vector maps, along with the global, street-level details of OpenStreetMap.

The overall aesthetic is kept light to serve as an unobtrusive baselayer for GeoJSON data overlays at any scale.

Place names are shown with more contrast at low zooms and less contrast at higher zooms to bring street names into focus.
Github is one of our first partners using the new custom vector tiles, something we are going to be rolling out to the larger public soon. Vector tiles make it possible for anyone to make a totally custom branded map – of the entire world – with no sacrifices in speed or device compatibility. For the cartographer, this means design iterations apply to a full global vector tileset in a matter of seconds – with no lengthy downloads, imports, or complex database queries. Watch AJ design a map in the new TileMill 2, our new design studio specifically built for vector tiles, to see how fast this can be.
Native GeoJSON Rendering

Point features with custom marker symbols
Many individuals, business, and government agencies are using GitHub to store open data, documentation, and tools to work with open data. Statistics Finland uses GitHub to provide tools for easier access to their open data API. The United States Governments’ Open Data Policy is itself hosted on GitHub, enabling Pull Request-inspired policy changes.
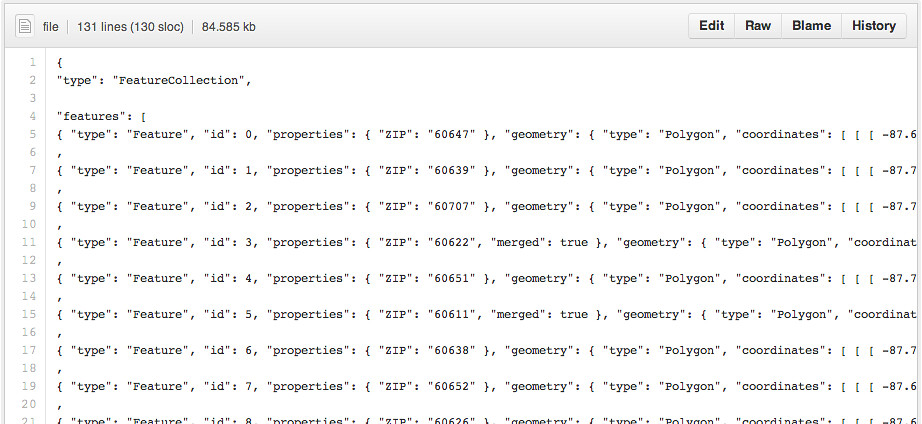
The new data visualization features added to GitHub repos have exciting implications for open data hosted on GitHub. Take, for example, SmartChicago’s zip codes dataset– previously displayed as raw GeoJSON on GitHub.

Chicago zip codes GeoJSON preview, before

Chicago Zip Codes GeoJSON preview, after
Your new visualization will even include interactivity. Feature properties are added to the feature’s popup window, enabling visitors to fully interact with and explore the dataset.

Sample showing complex polygon-rendering capabilities. DC Buildings database as a GeoJSON Preview on GitHub
Make Your Map
Maps on GitHub.com support rendering EPSG:4326 projected geometry types in the GeoJSON spec, including Point, LineString, Polygon, MultiPoint, MultiLineString, MultiPolygon, and GeometryCollection. To test out the new feature on GitHub, it’s as simple as committing a GeoJSON file to a repository.
For point geometry types, GitHub leverages our static Markers API to offer additional customization options to users.
marker-size: one ofsmall,mediumorlargemarker-color: a valid RGB hex color, like#ff4444marker-symbol: an icon ID from the Maki project or a single alphanumeric character (a-zor0-9)
Simply add any of these attributes to the GeoJSON feature’s properties to customize the way the point is displayed on the map.

Custom Marker Colors
For more information on the functionality, check out GitHub’s docs for visualizing GeoJSON data.