How football fans in Miami and the nation impacted speed and volume
By: Sofia Heisler
It’s been one week since the Kansas City Chiefs beat the San Francisco 49ers in Super Bowl LIV in Miami. We were curious, with over 65,000 people descending on Hard Rock Stadium in Miami Gardens, FL, and reports of fans hopping out of their cars and walking the Florida Turnpike not to miss a minute of tailgating, how bad was the traffic compared to a typical Sunday.
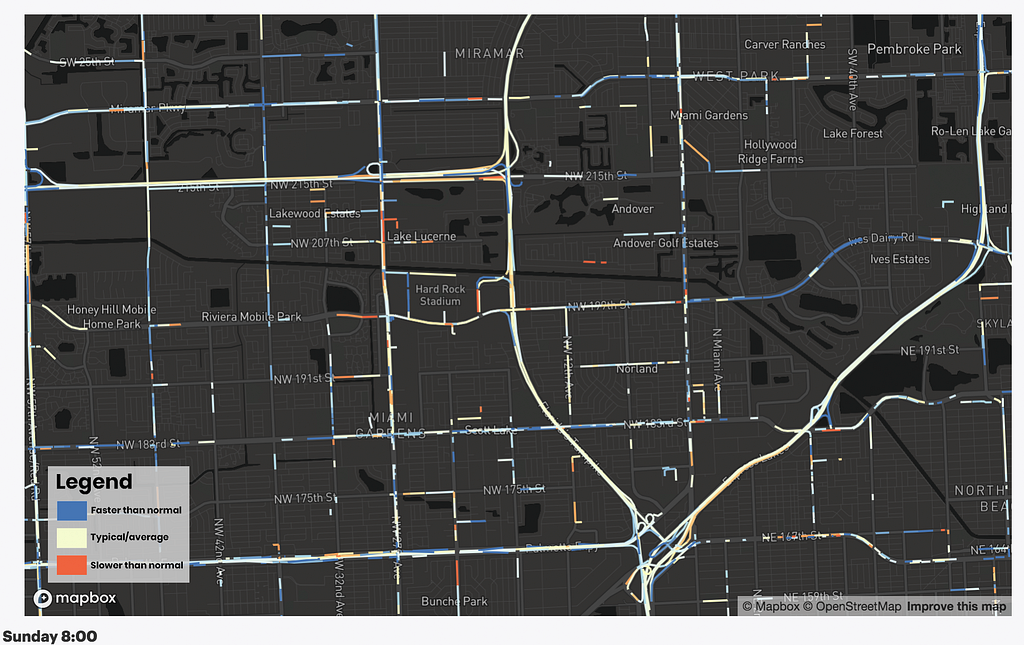
Typically, we use our speed and traffic density data to predict what speeds should be on a regular day, but we can also use it track how speeds change in real time when unusual events like the Super Bowl happen. In the map above, we can see see the speed around the stadium on Super Bowl Sunday relative to the average speeds on a typical Sunday. Between 8 and 9 am, fans were still starting their day, and traffic still looked much like an average Sunday, with typical speeds represented in light yellow, and even faster than typical shown in blue. (Note: We only color in the streets where the volume of traffic was high enough to accurately estimate a live speed on Sunday.)
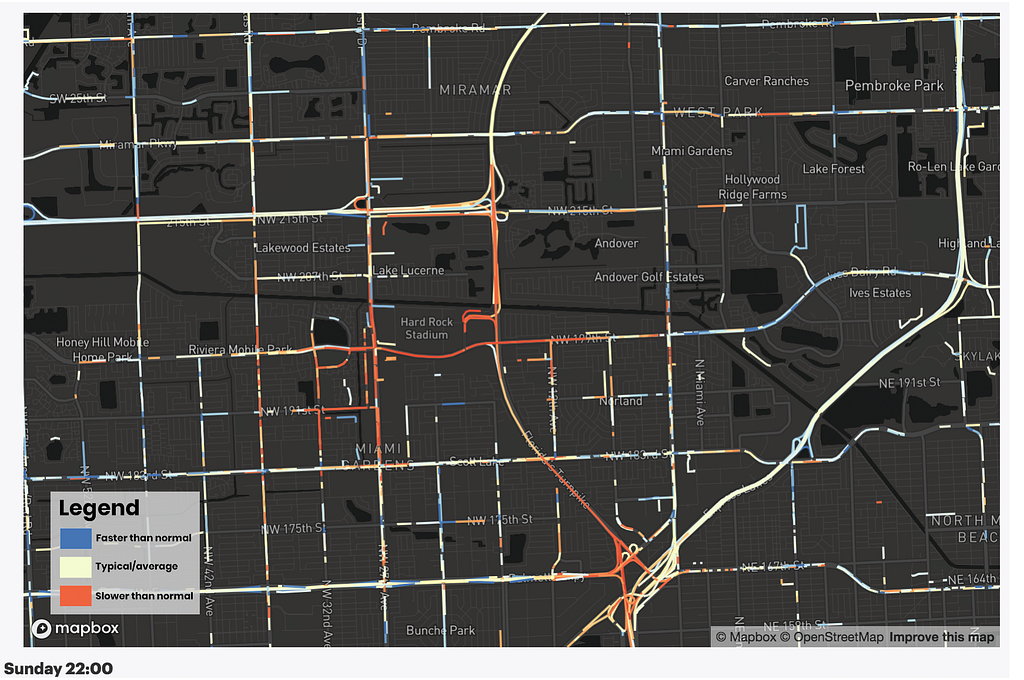
If we compare these traffic patterns to speeds between 10 and 11 pm when the game let out, it tells a much different story. Our live speed monitoring captured the slowdowns that appeared all around the stadium and extended out onto the highway as fans poured out of the stadium and headed home or out to celebrate the win. Speeds on some of the major artery streets leading up to the highway interchange slowed down by as much as 10–20 mph!
It’s evident in the map above that besides slowing down major artery roads, the traffic from the game also impacted several smaller side streets around the stadium. This brings up an interesting question: did the game-day traffic overflow into the local neighborhood, causing increased or unusual traffic patterns?
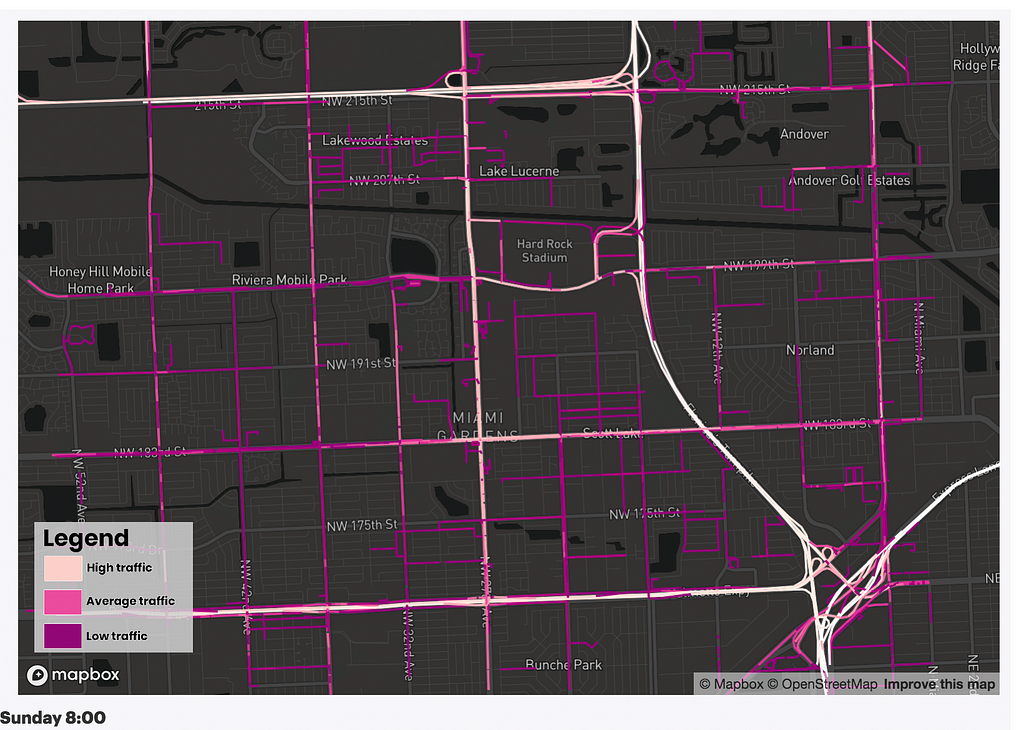
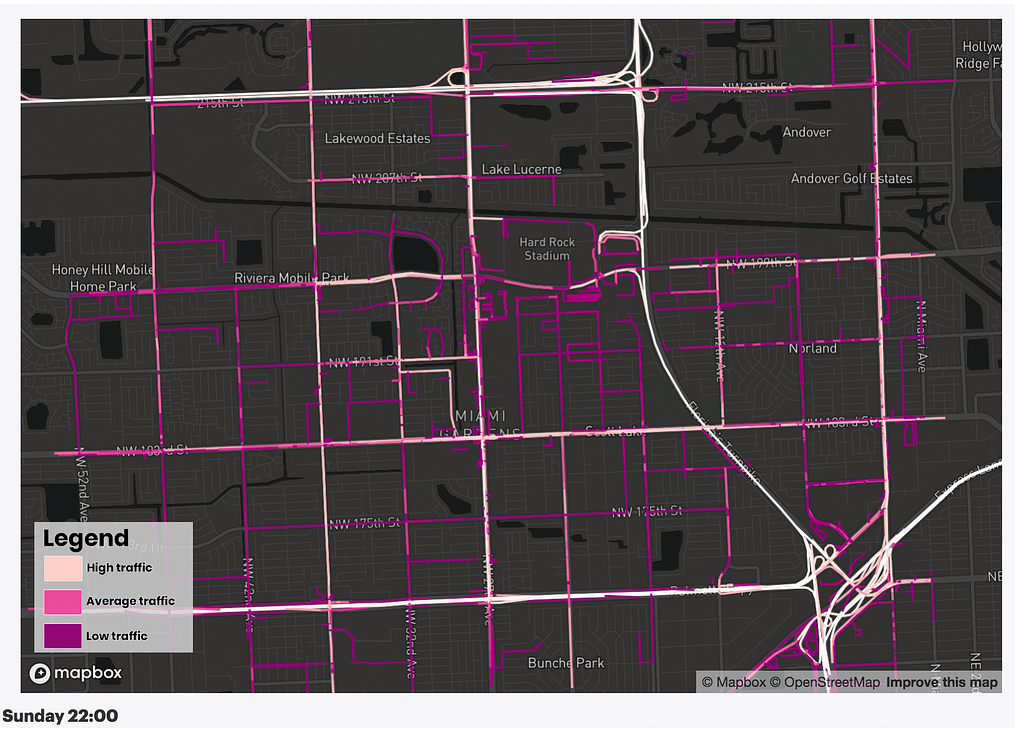
Looking at local streets in the map above, traffic volumes at 8–9 am and 10–11 pm, respectively, suggest that the game did cause some unusual congestion in the local streets. You can see smaller residential streets “lit up” with traffic on the second map relative to the first: as the traffic on primary roads slowed to a crawl at the end of the game, many drivers likely routed to secondary roadways across the neighborhood in an attempt to get out faster.
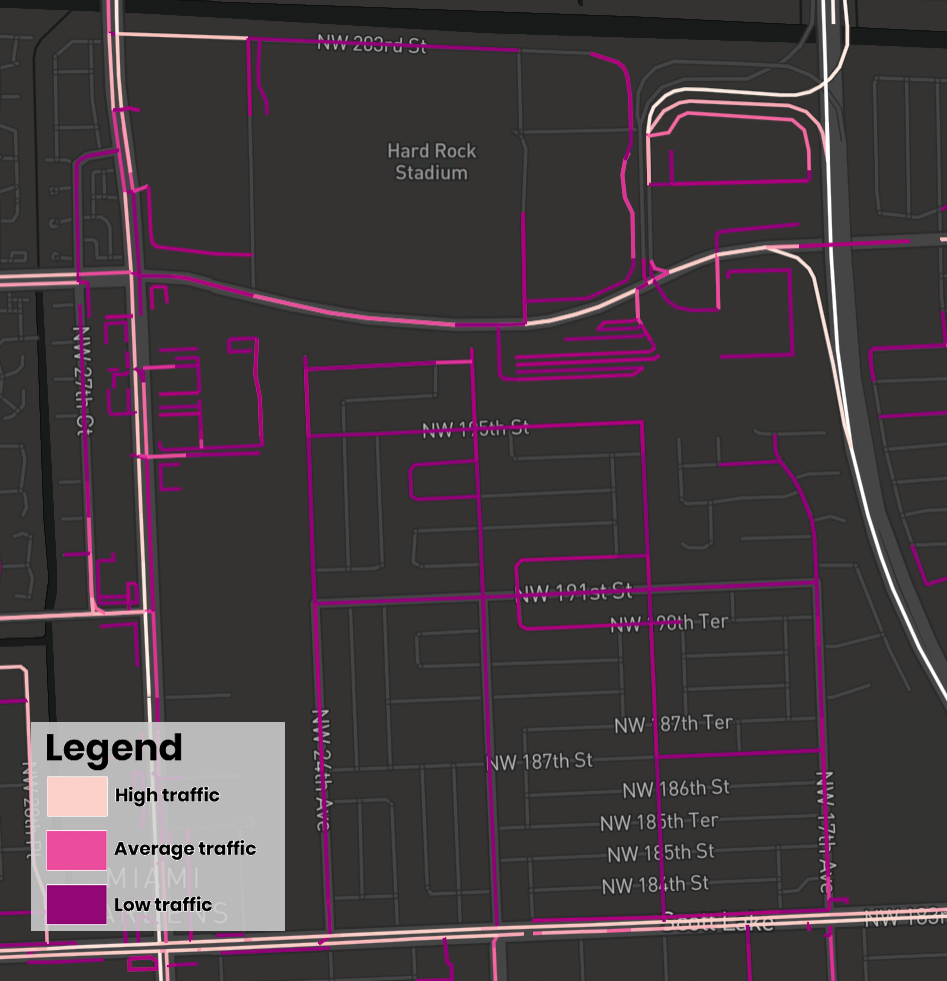
For example, let’s zoom in on the small residential community directly south of the Hard Rock Stadium. A quick review suggests that the only roadways connecting this area to the outside world are on the south side of the neighborhood, making it impossible to cut across the neighborhood to reach the stadium. It’s a reasonable guess that the relative increase in traffic was caused by drivers unfamiliar with the area attempting to pick people up after the game, and getting lost in residential streets.
Impact on 49ers traffic
Of course, Miami Gardens was not the only area affected by game-day traffic. We expected that most major cities in the U.S. would experience some degree of unusual traffic patterns, as football fans all over the country gathered at their friends’ houses and bars to watch the game. So I first took a look at San Francisco, home of the 49ers.
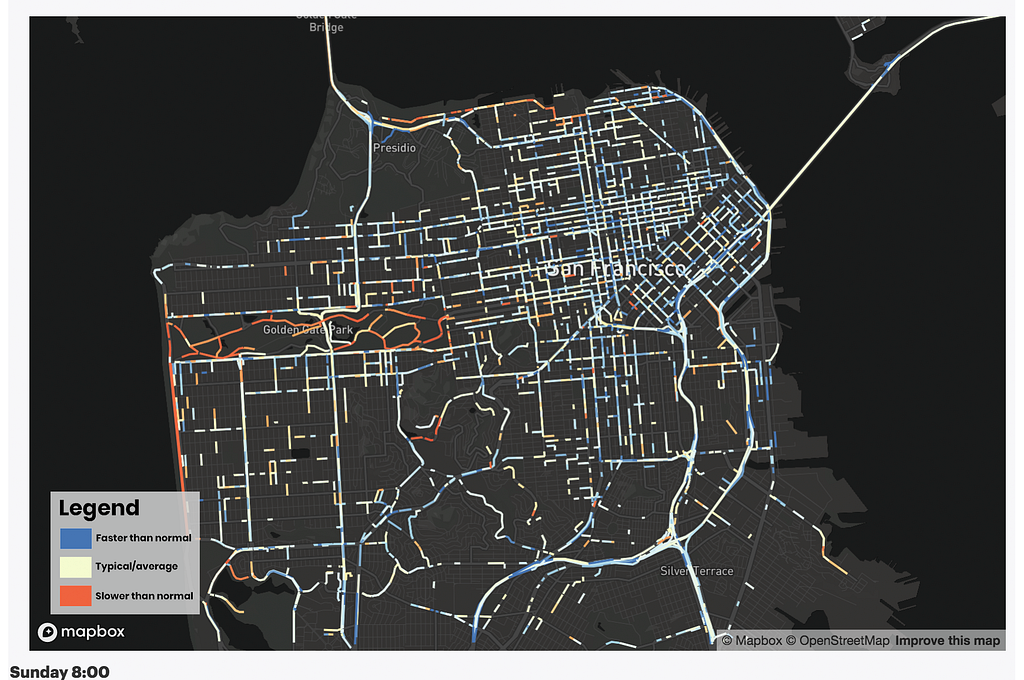
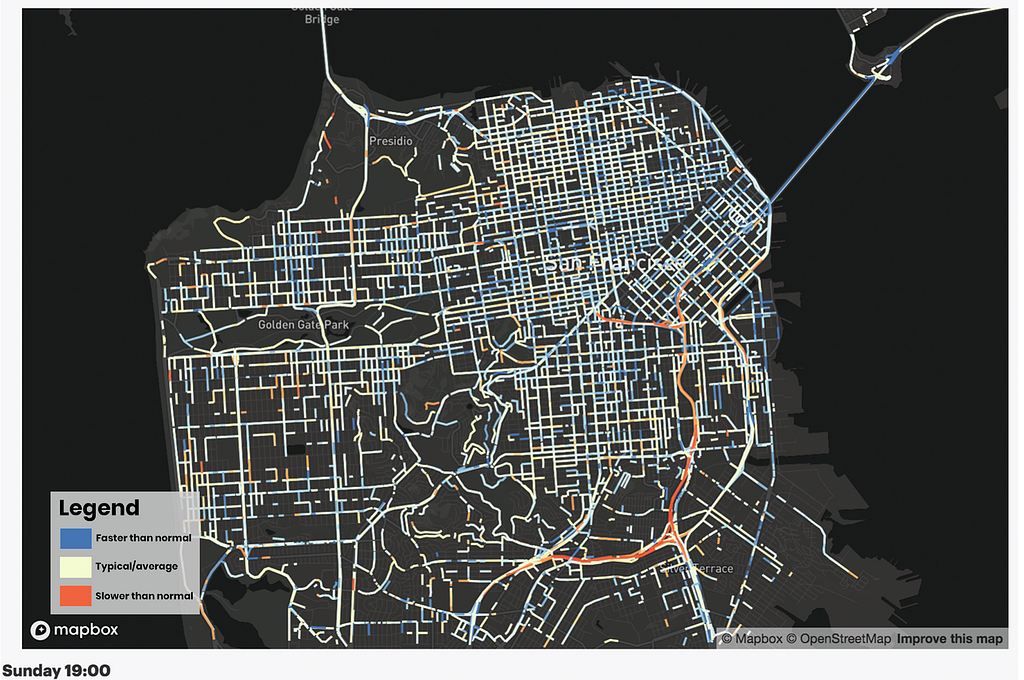
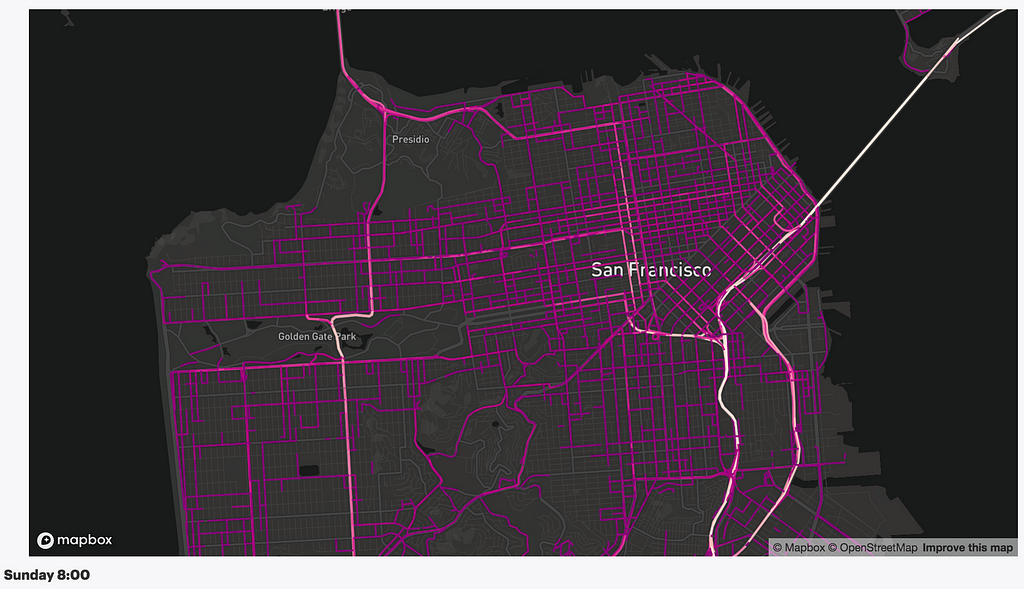
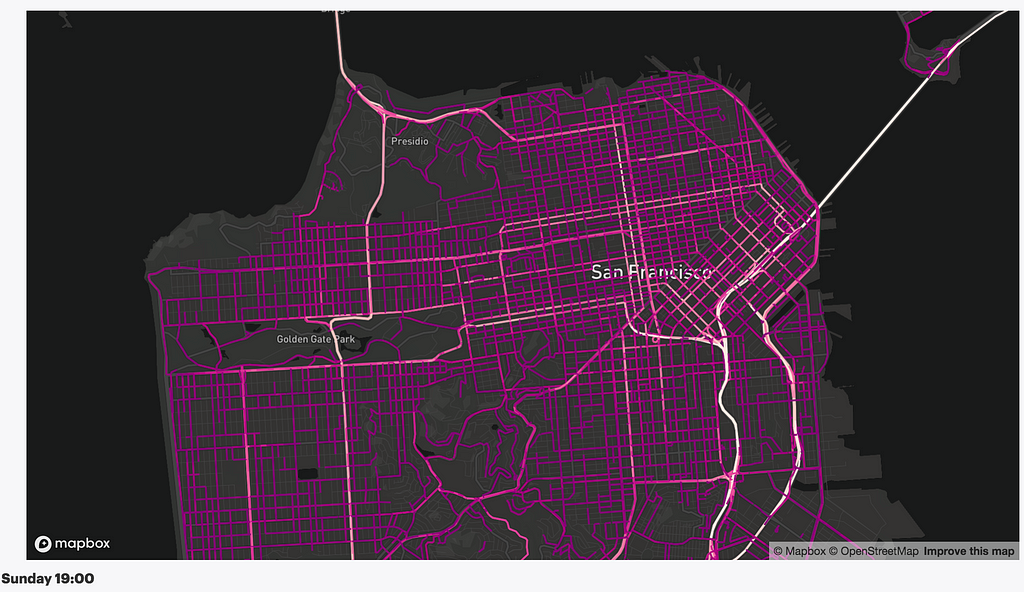
San Francisco also saw heightened traffic volumes after the end of the game: the bar districts in SOMA, the Mission, and Haight street “light up” particularly brightly on our traffic volume maps. Looking at our live speeds layer, it was interesting to see that the only major roadway to experience significant delays as a result of the event was the part of US-101 that goes through the city.
Delays across the country
The Super Bowl is a nation-wide event, so I wanted to zoom out to understand which parts of the country were the most significantly affected by delays on game day. To do so, I mapped the relative speeds on highways across the country on the day of the Super Bowl.
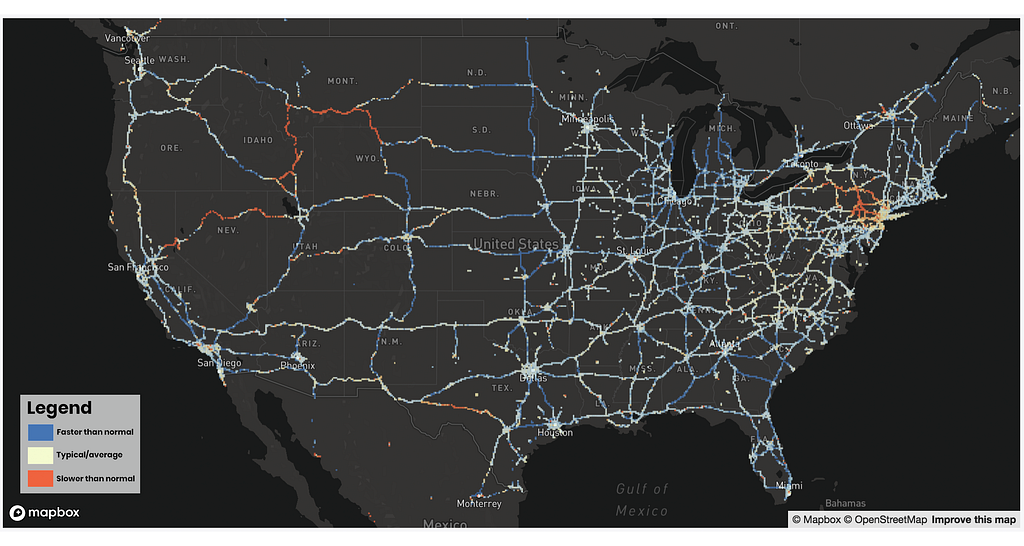
Pacific Northwest saw the worst of the slowdown, likely due to inclement weather. For example, we can see the speed on 1–80, which runs along the border between Nevada and Oregon, were over 20 miles lower than average throughout the day on Sunday. Parts of Pennsylvania, particularly near New York City, were also hard-hit by the game-day traffic, as was the Big Apple itself. On the other hand, the Midwest, with its wealth of open roads, remained blissfully undisturbed by traffic jams. In most cities, the worst congestion occurred on the highway segments at the entrance/exit to city centers, as fans poured in to watch the game in downtown bars.
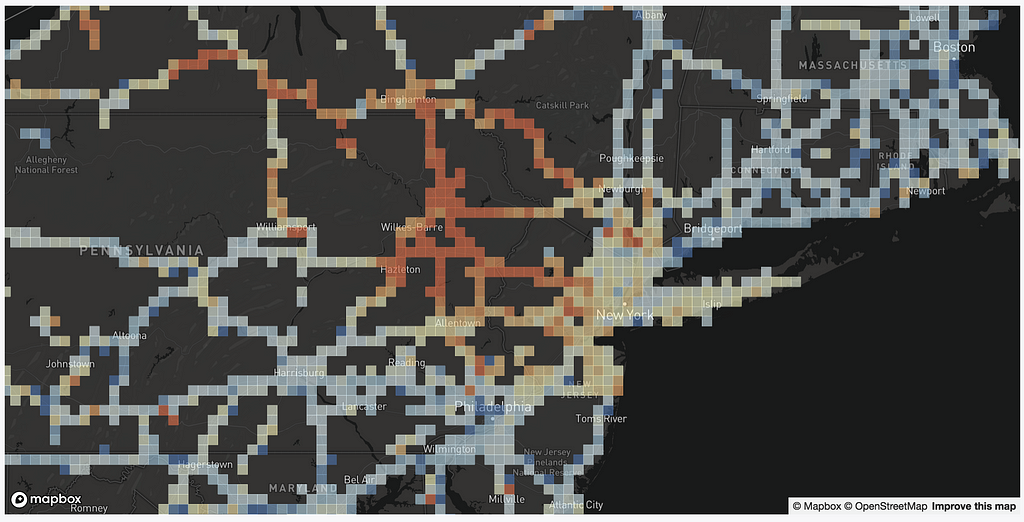
The ultimate (traffic) loser seems to be New York, which experienced some of the most significant overall slowdowns on major roadways relative to a typical Sunday.
Our traffic and speed data let us analyze unusual events and their impact on traffic and is also available for developers to create better navigation products, improve logistics planning, and help people get where they’re going on time. Learn how you can build with our speed and traffic products.
Sofia Heisler - Data Scientist - Mapbox | LinkedIn
Traffic trends during Super Bowl LIV was originally published in Points of interest on Medium, where people are continuing the conversation by highlighting and responding to this story.