Integrating geocoding, isochrones, and Atlas
By: Hannah Judge
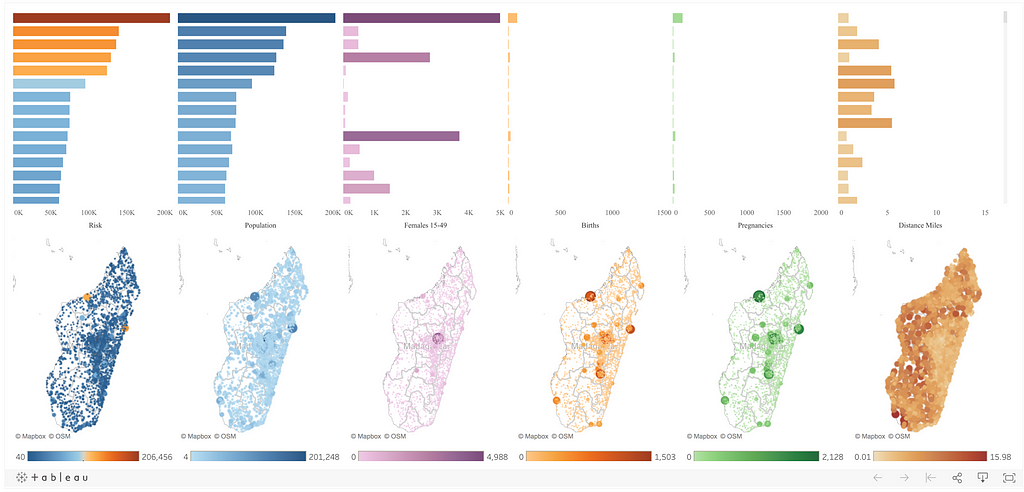
Tableau’s maps are powered by Mapbox, enabling users to access fast, smooth vector maps and fresh new styles.
Out of the box, the integration opens up additional map functionality for Tableau’s customers, including zoom in to building level for more detail, use satellite imagery, and toggle layers on and off. The enhanced ability to see and understand the geographic context of data is having an immediate impact for customers like Verizon, who was able to cut service dispatch analysis time in half:
Mapping features in Tableau, like the Mapbox integration, allowed the team to identify a location-based impact through heat maps and revealed where ticket and dispatch rates over-performed or under-performed and what variables led to the frequent dispatches.
Consequently, Verizon reduced technician dispatch analysis time by more than 50 percent and discovered how geospatial mapping can support other organizational needs.
And that’s just the beginning of location capabilities in Tableau.
Watch the webinar I recorded, highlighting how to get more from Mapbox’s integration in Tableau with Atlas, geocoding, and isochrones, and read more below.
1. Atlas for full-featured maps on your own infrastructure
If you work for a highly regulated sector such as government, finance, or healthcare, or your IT restrictions make it difficult to access maps in Tableau, Mapbox can help.
Atlas, our on-premise mapping product, (aka Mapbox in a box,) allows you to have the same maps and data as every other Tableau user, but running on your own hardware. For the first time, you can have access to your maps and data within your firewall or even offline, without losing any detail or functionality.
Once you have Atlas running, use tabAtlas to quickly connect it with Tableau. All you need is the same URL you would use for adding custom background map and tabAtlas will do all the heavy lifting to make Atlas your default mapping provider. tabAtlas is available on GitHub now, well documented and ready to integrate!
2. Geocoding to enrich your data with additional latitude/longitude information
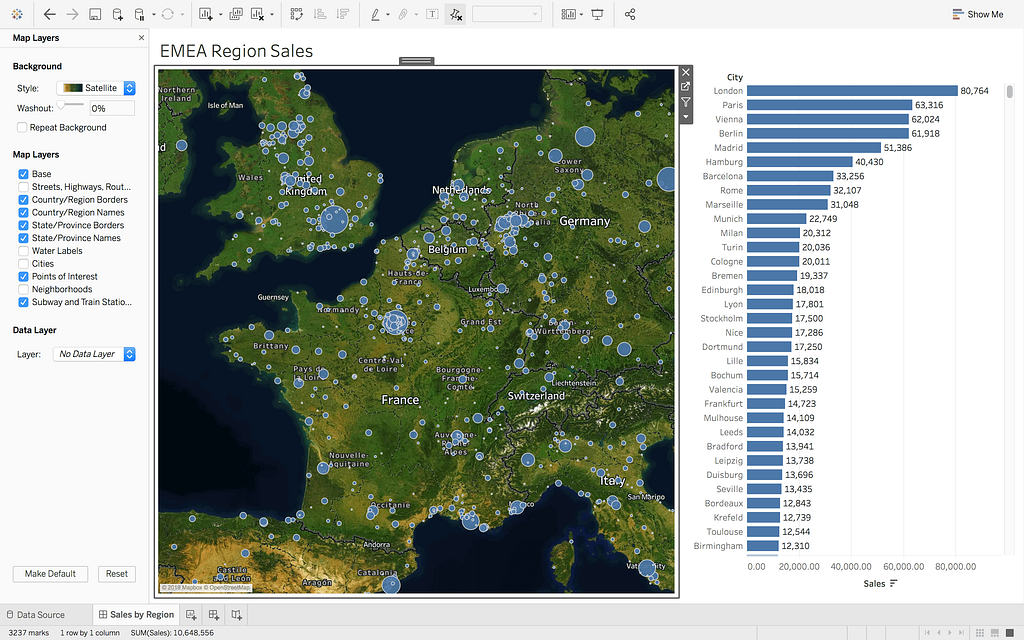
Tableau provides you with a large amount of geospatial data out of the box. Desktop and Public users can visualize their data by worldwide Countries, State & Provinces, CBSA/MSAs, Counties, Cities, Area Codes, NUTS, Postcodes, and Congressional Districts.
But if your data doesn’t contain one of these categories, or you want to visualize individual points, you need geocoding. For example, if you want to visualize a sales territory or build a density map based on a list of customer addresses, you need to convert your addresses into latitude and longitude coordinates. This process is called forward geocoding.
It’s now possible to enrich your data with location directly in Tableau Prep with the worldwide coverage of the Mapbox Geocoding API, no code necessary. All you need to start geocoding is a few clicks, and a paste of your Mapbox token — just follow the steps outlined in the GitHub repo. Only pay for what you use, with pricing starting at $5/1000 API calls and automatic volume discounts. Check out our pricing page here for more information or just get in touch!
3. Isochrones to power spatial analysis like site selection and population analysis
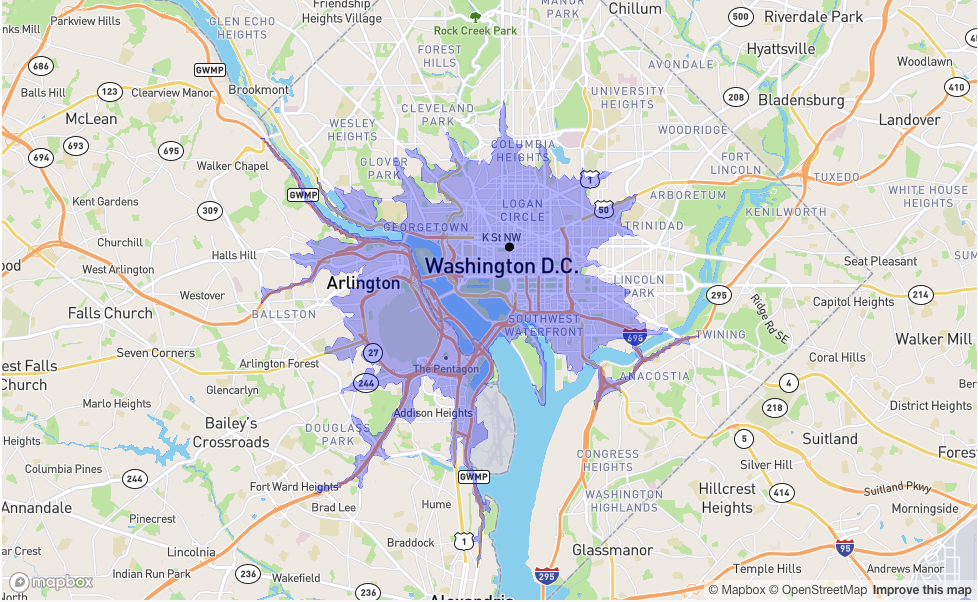
Sometimes you need to answer questions like: How many parks are within a 20-minute walk from the apartment buildings I’m showing a customer? How many of my employees could still reach a potential new office location within a 20-minute drive? What restaurants should I service for my new food delivery app, so we can commit to a 30-minute delivery window?
To perform these analyses, you need to use Isochrones. The Mapbox Isochrone API uses routing profiles and travel times to power applications that show users the area they could expect to reach by foot, bicycle, or car within a set amount of time. We don’t have a direct integration… yet 😉, but since both the Isochrone API and Tableau speak geoJSON, here’s an example of what you can do with this type of location data.
Bridges to Prosperity (B2P) works with isolated communities to create access to essential healthcare, education, and economic opportunities by building footbridges over impassable rivers. In the webinar, I talk through an inspiring example of how B2P is using multiple tools — including Salesforce, Alteryx for Good, Starschema, Data Blick, the Tableau Foundation, and Mapbox — to estimate the immediate impact of new footbridges in rural Rwanda.
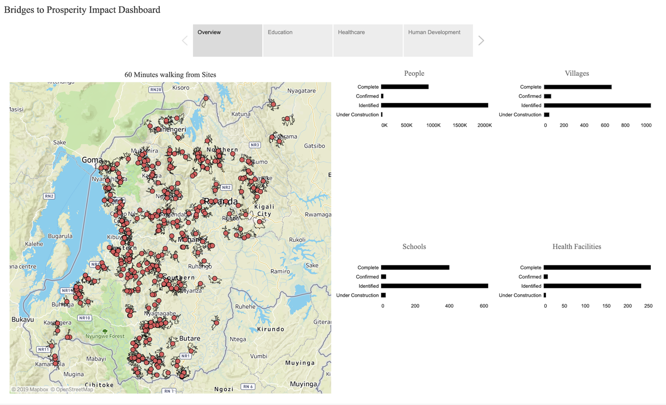
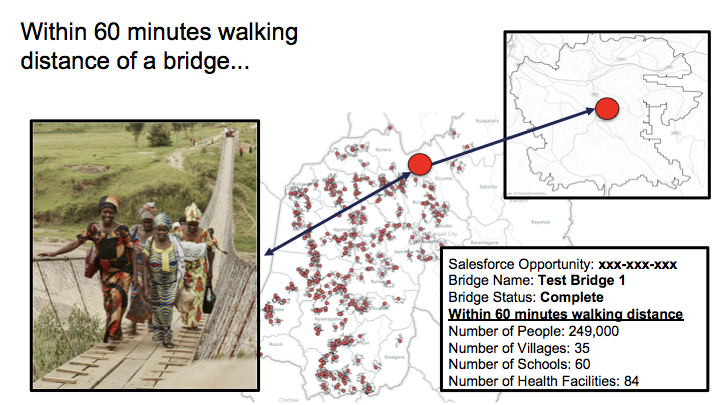
Using the Mapbox Isochrone API, we calculated an area for each bridge site that represents the distance that can be covered with a 60-minute walk — before and after the bridge has been built. Those are the spidery looking lines on the map. The answer to this simple question, what is accessible by foot, supports B2P’s conversations with funders and governments interested in investing in pedestrian infrastructure in the rural last mile. It will allow the organization to quickly visualize where barriers to access still exist, and work more effectively with its government partners and other service providers to address those gaps.
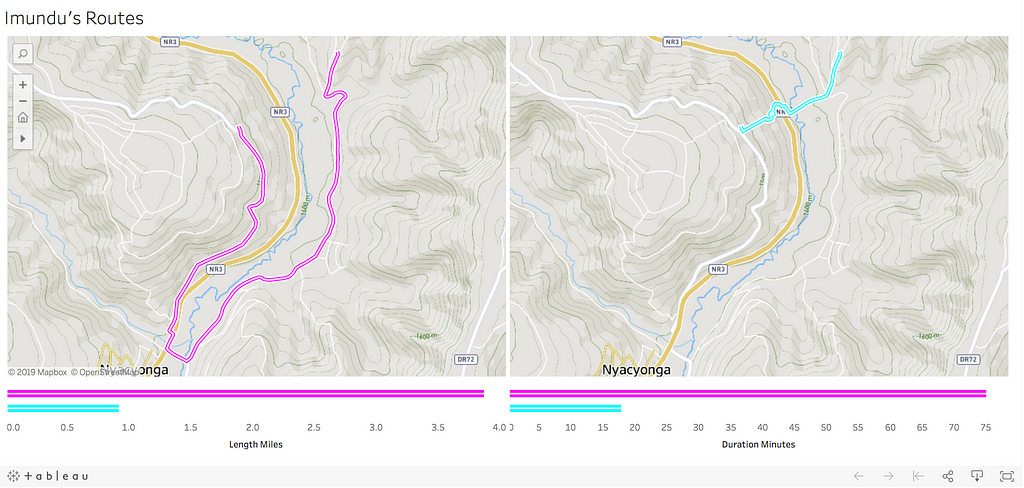
If isochrones are functionality you’re interested in incorporating into your own Tableau dashboard, reach out to our team and we can help you sketch out a plan using one of our Data Prep solutions.
If you missed the webinar, catch the replay here. And don’t hesitate to reach out if you want to talk through your implementation, we’d love to hear what you’re building: sales@mapbox.com.
Hannah Judge - Senior Technical Account Manager - Mapbox | LinkedIn
Three ways to extend location capabilities in Tableau was originally published in Points of interest on Medium, where people are continuing the conversation by highlighting and responding to this story.