How Moji Weather enables seamless weather animations with Mapbox GL
By: Macro Shen

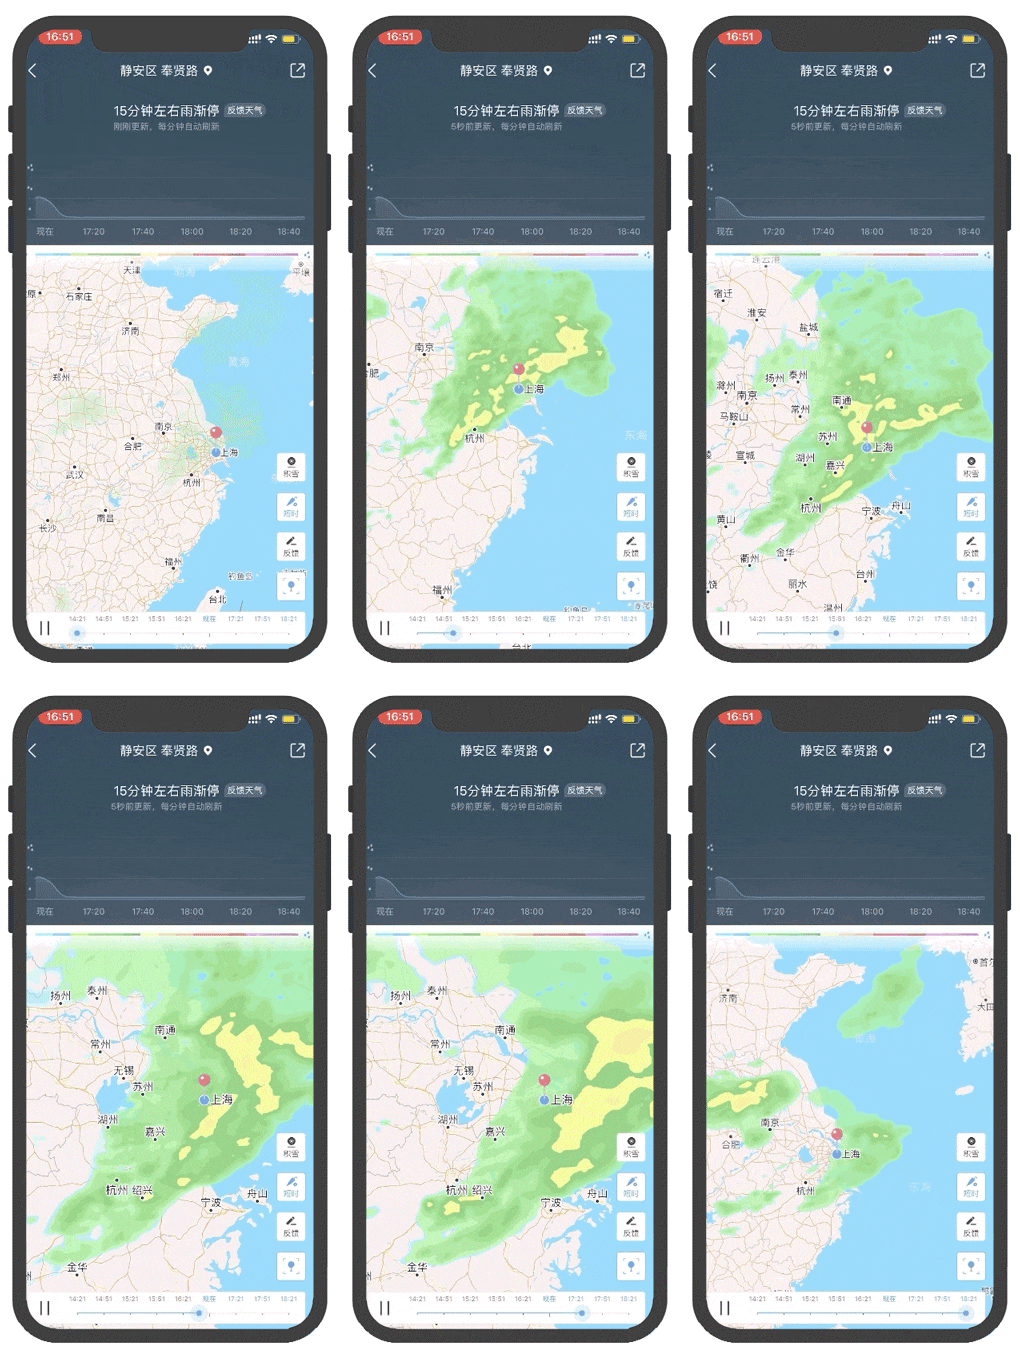
Moji Weather, the creator of China’s largest weather app, visualizes radar data, AQI (Air Quality Index), and other weather conditions with Mapbox GL for its Android and iOS apps. Radar data are among the most difficult to render quickly on native apps — Moji Weather realized this challenge and reached out to Mapbox for a solution, eager to move away from their previous raster-based mapping platform. We created a solution that enabled fast and smooth visualizations overlaid on Mapbox Streets Chinese, our licensed base map in China. Below we walk through the building blocks that made this possible.
Traditional radar data visualization
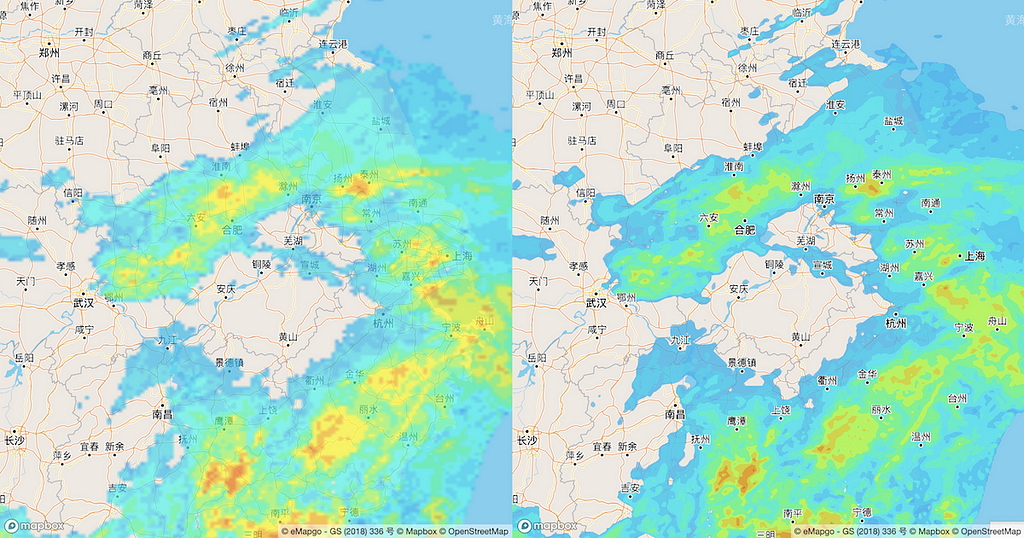
Precipitation data are typically derived from radar sources — the format of these raw data are usually raster images. When visualizing these, the common approach is to add multiple images on the map as raster source, or generate to image tiles, and then display data with a time-lapse effect by showing different images per frame.
Many weather apps use this approach to visualize radar data, including Moji’s previous versions. However, there are two main shortcomings:
- The resolution is low when zoomed in.
- Animations are not smooth.
New approach to data visualization
Mapbox vector tiles enable data-intensive maps to render quickly while offering full design flexibility. These are the vector data equivalent of image tiles for web mapping, applying the strengths of tiling — developed for caching, scaling and serving map imagery rapidly — to vector data.
For Moji we decided to visualize radar data through vector tiles. First, we needed to convert raster images to vector format (GeoJSON), and then generate to Vector Tilesets.
1) Vectorize the radar data
There are many open source tools to vectorize raster image. For example, d3-contour generates contour polygon from images in a Node.js environment or use numpy / rasterio in a Python environment for generating pixel polygons from images.
Here is the sample code using d3-contour.
In addition to vectorizing, we also converted the coordinate system from pixel to geo before generating GeoJSON data.
2) Interpolate the radar data to smoothen out transitions
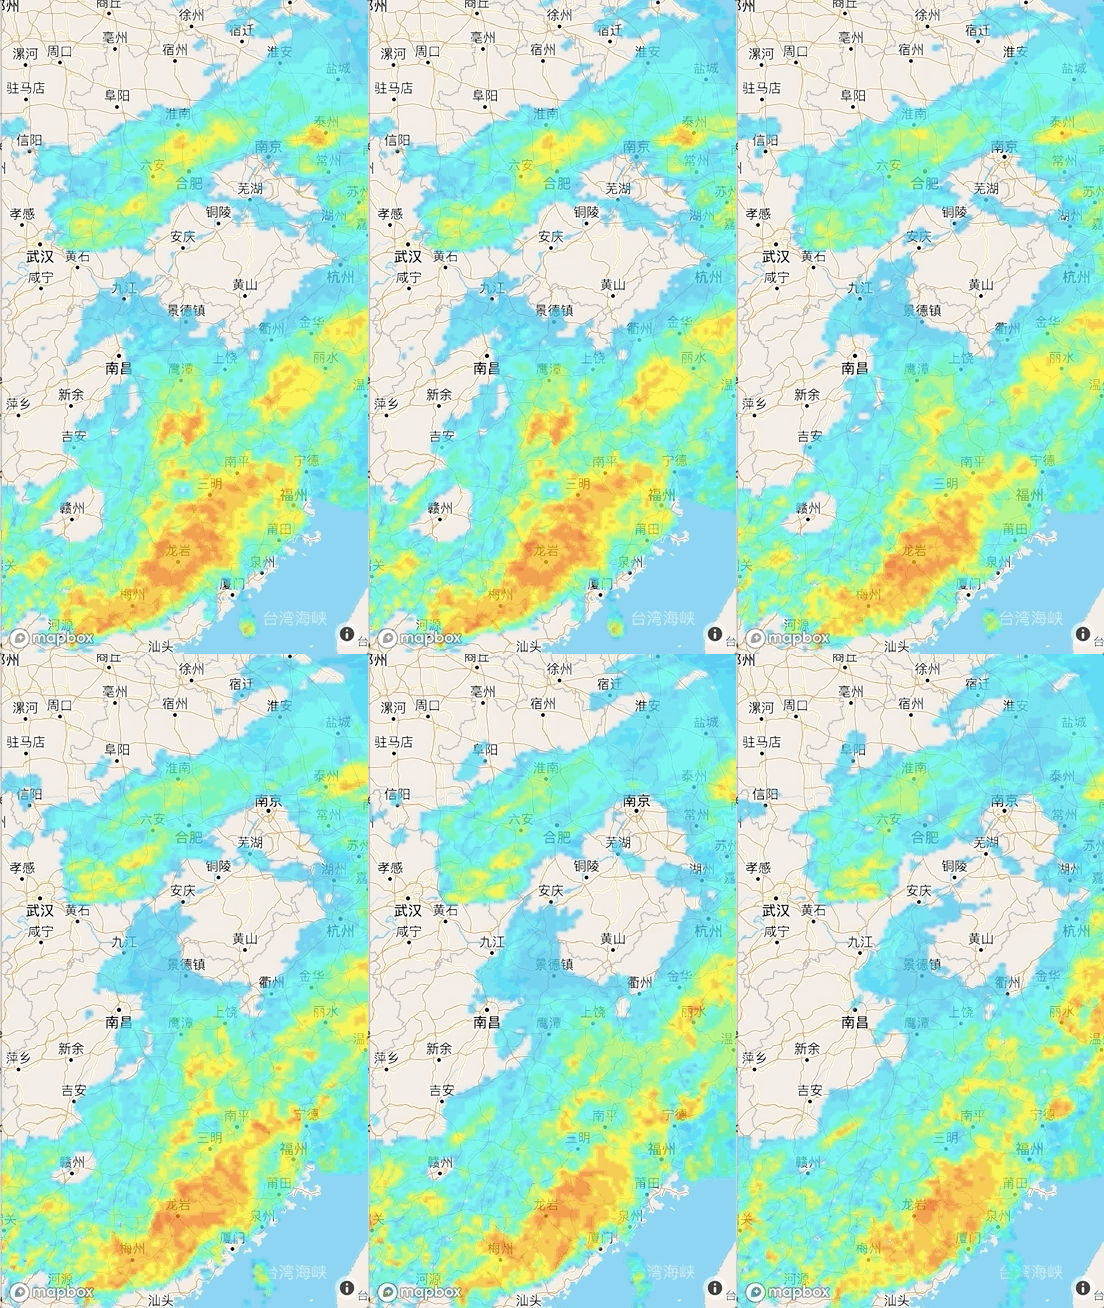
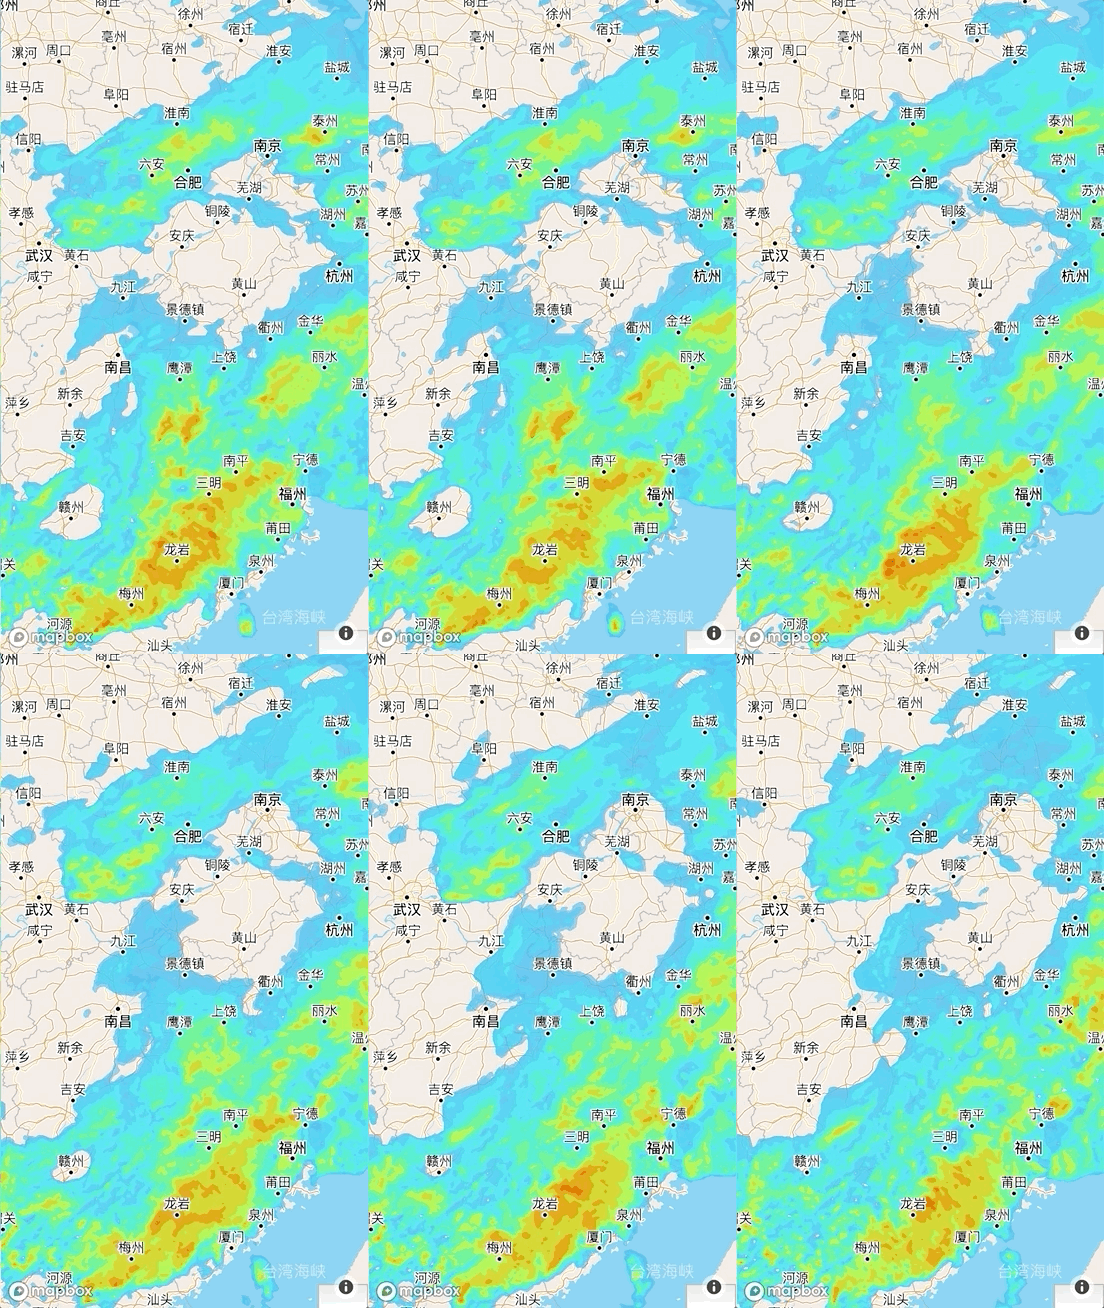
If we look at the traditional radar images side-by-side, the jumps between frames are obvious. We know the breaks would be less obvious with more frequent data frames. So we try to create intermediate radar images to improve frames per second for more fluid animations. Then, we run the processing script and generate more vectors, which would allow the animation to run with more steps and possibly appearing more fluid.
The easiest way is to interpolate the data between adjacent frames:
Note, we can also create more than 1 (e.g, 2 or 3) transition frames between original frames to enable more fluid animations, but at the cost of data size.
3) Build Vector Tilesets from GeoJSON
To generate vector tiles we utilized tippecanoe, a powerful tool to build vector tilesets from large collections of GeoJSON, Geobuf, or CSV features.
The easiest way to install tippecanoe on OSX is with Homebrew:
$ brew install tippecanoe
After installing tippecanoe, we used the following command to generate mbtiles:
$ tippecanoe -o output.mbtiles -zg --drop-densest-as-needed radar.geojson
Note: -e can be used to write tiles to the specified directory instead of to an mbtiles file, supporting those wanting to publish vector tileset to a web service.
4) Visualize radar vector tiles using Mapbox GL JS or Mapbox Maps SDKs for iOS and Android
After the radar vector tileset is published, Mapbox GL JS or Mapbox Maps SDKs for iOS and Android can be used to load and visualize radar map.
Here is a sample code using Mapbox GL JS. There is also an example for Android SDK.
At last, we use `setFilter` function of Mapbox GL to animate the radar data smoothly:
The output is a map with improved UX: smoother and higher resolution renderings compared to traditional visualization.


Moji’s radar map takes advantage of Mapbox vector tiles to display clean stutter-free radar visualizations. Contact our China team if you are interested in using our maps and technology.
Macro Shen is a Solutions Engineer for Mapbox.cn, based in Shanghai.
Visualizing radar data with vector tiles was originally published in Points of interest on Medium, where people are continuing the conversation by highlighting and responding to this story.