Build your own 3D map with LIDAR point clouds
By: Allan Walker
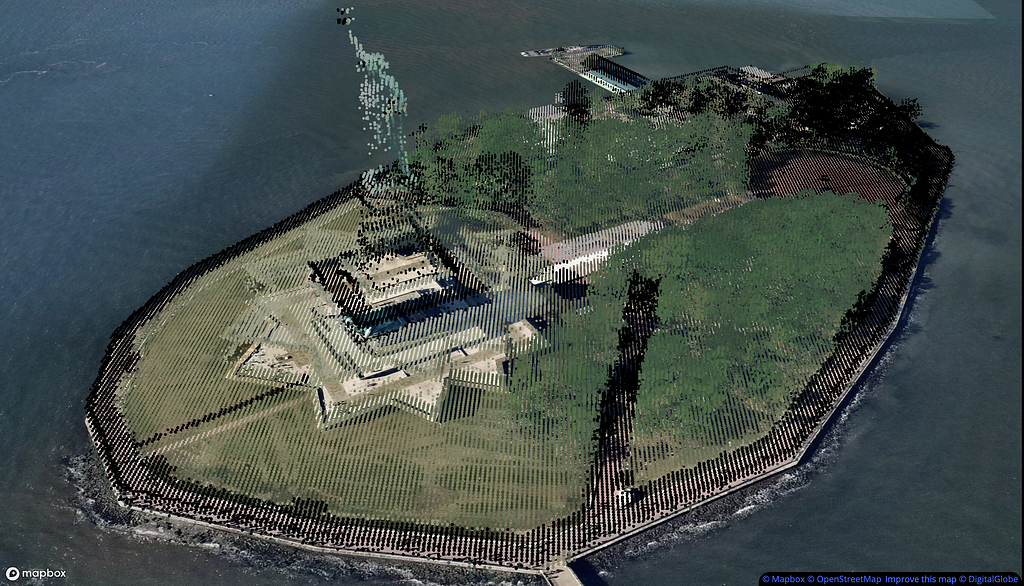
I love visualizing LIDAR! Now that Mapbox GL JS and Uber Engineering Deck.gl work together we can leverage this to bring these LIDAR point clouds into context with a map and add a method to color the points.
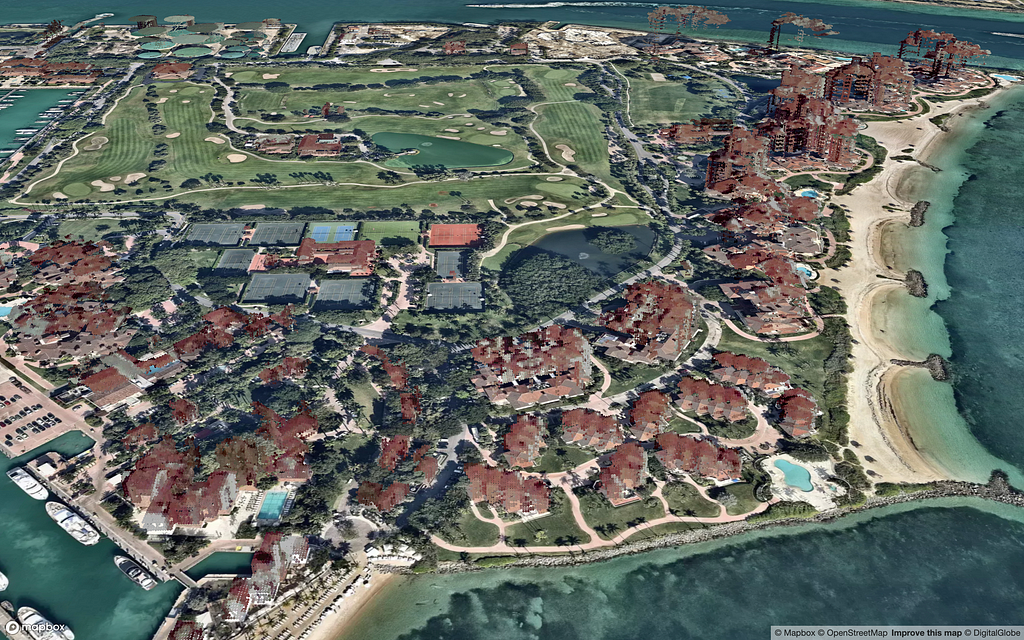
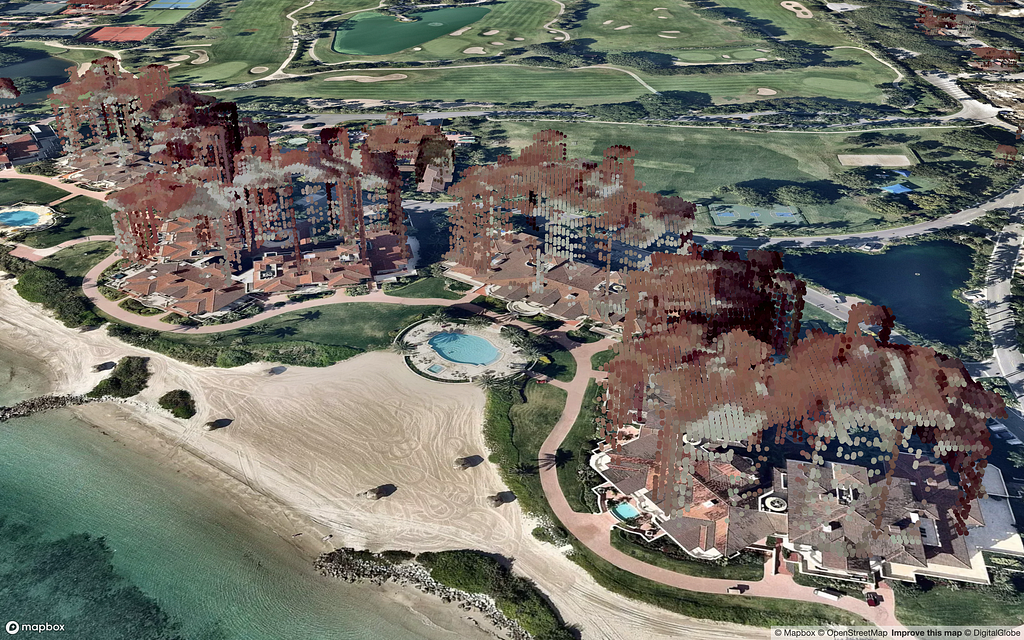
If you are in real estate, and need to visualize buildings on a map in really high detail — this could be a great method to showcase your portfolio. Here’s an example of Fisher Island, Miami, Florida.
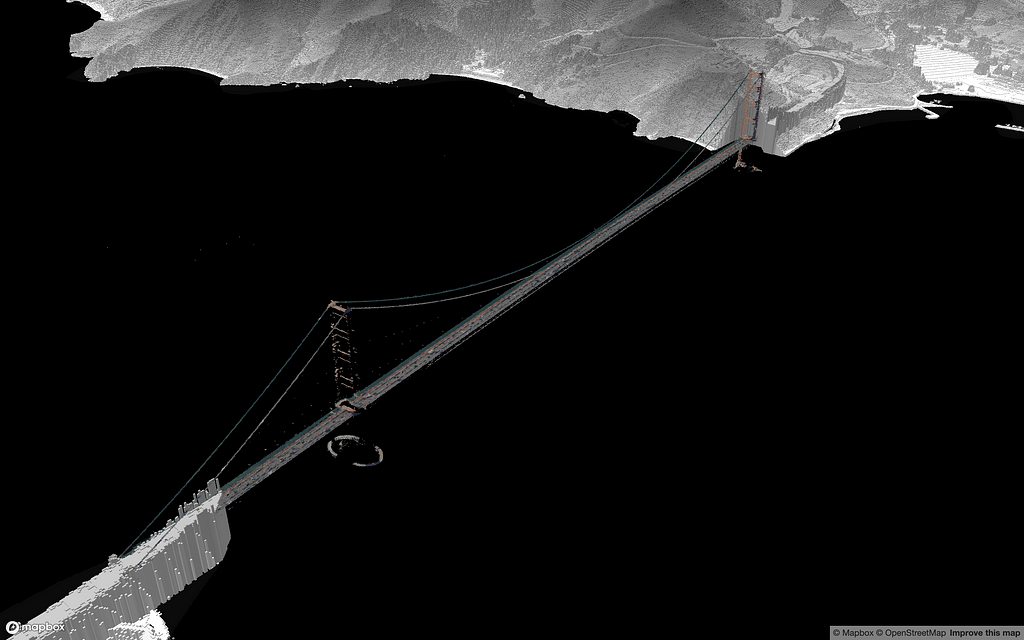
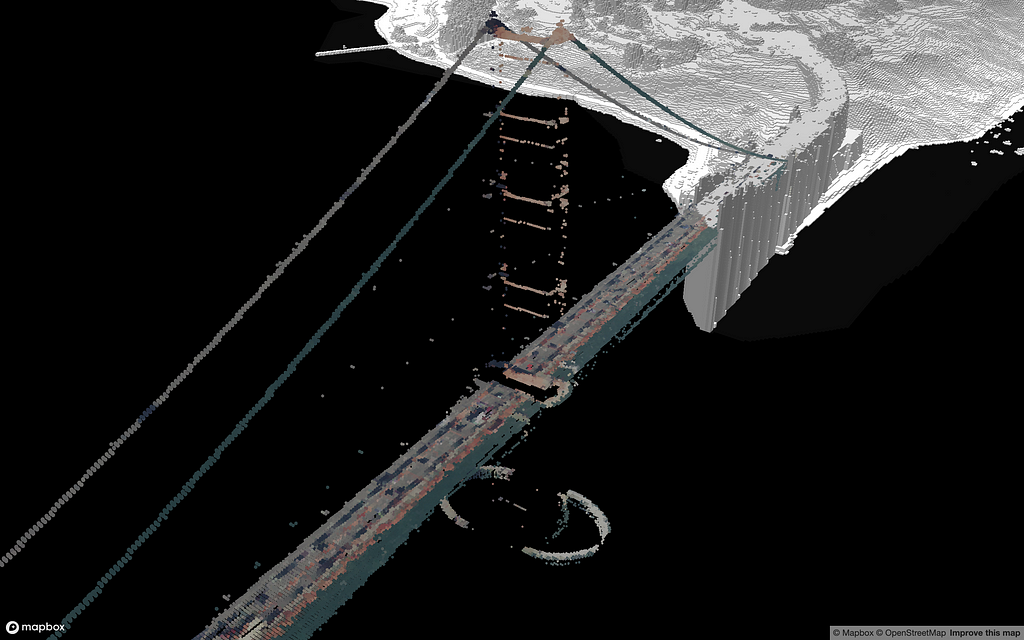
Here’s how to build your own 3D map using colored LIDAR points. Let’s make one of the Golden Gate Bridge.
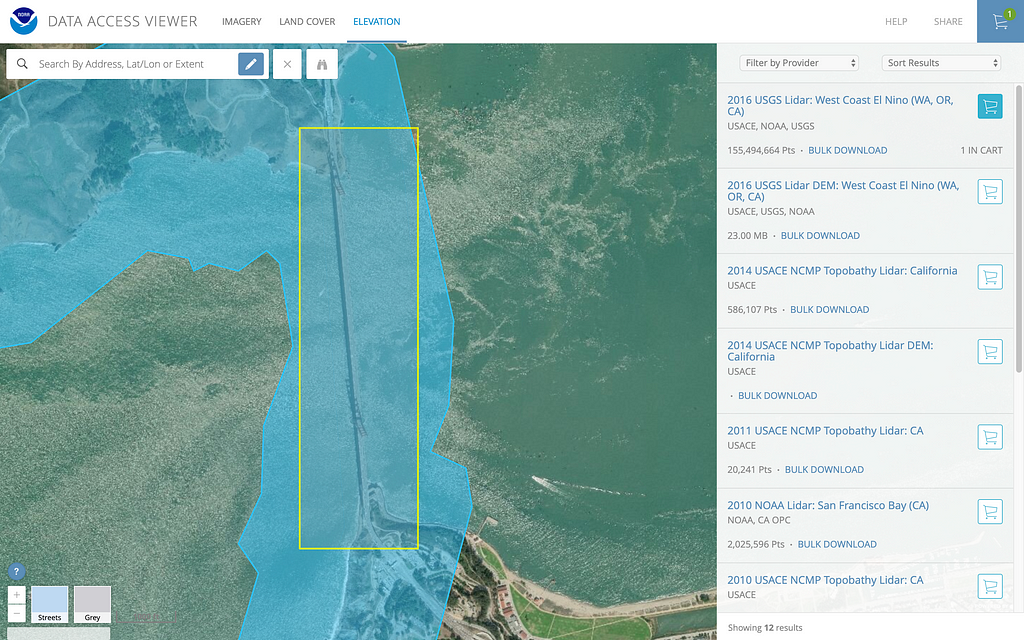
First, head on over to the fantastic resource that is the NOAA elevation website. We’ll search for elevation, choosing the 2016 USGS LIDAR West Coast El Nino (WA, OR, CA).
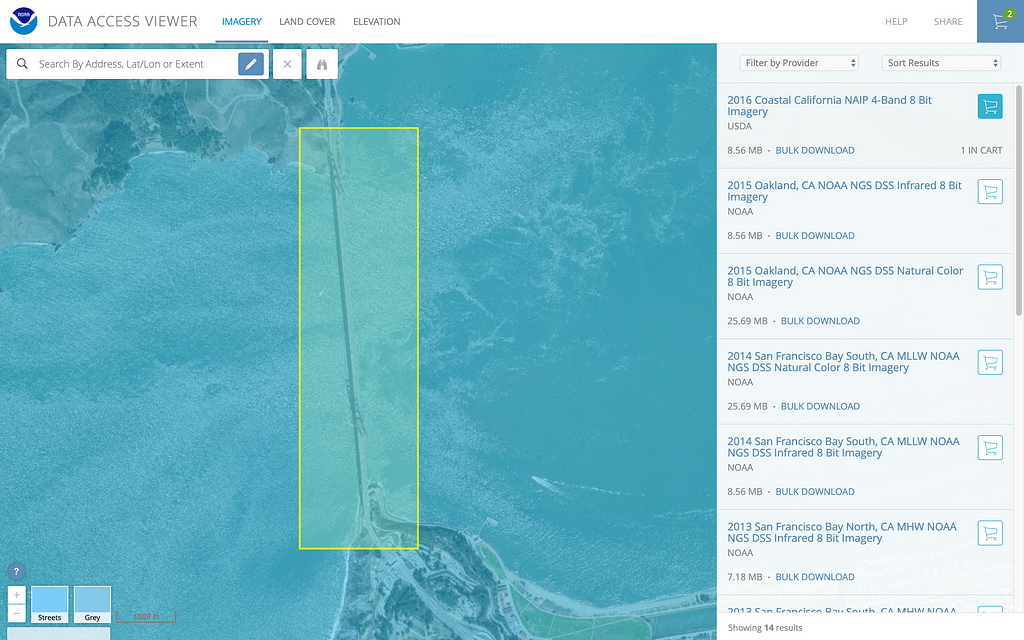
Next, we’ll search for imagery. Choose the 2016 Coastal California NAIP 4-band 8 bit Imagery.
Next, change some settings in the “Provision your data” screens. Because Mapbox uses web mercator, and Deck.gl uses metric values for heights, these settings will reduce a few steps later (such as re-projecting the LIDAR and Imagery files).
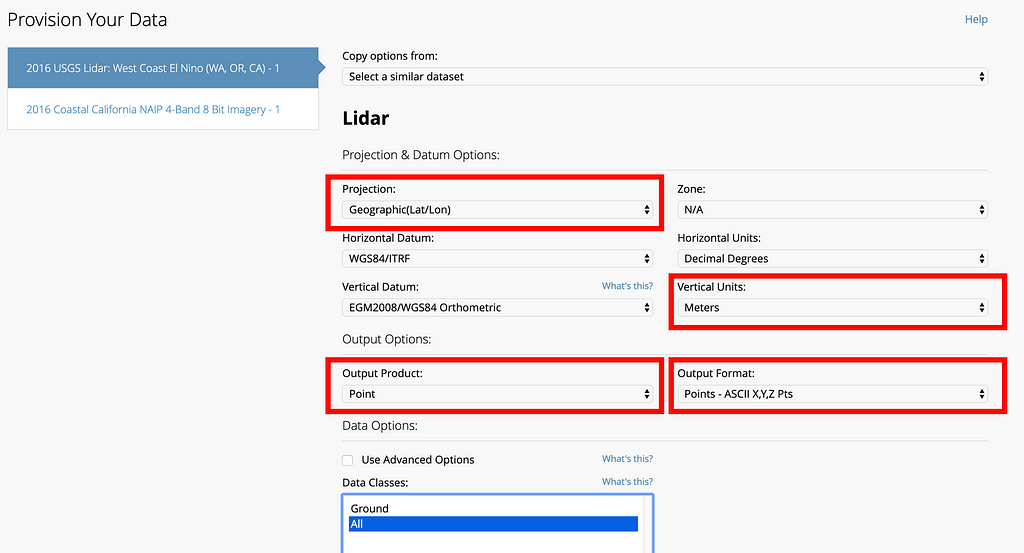
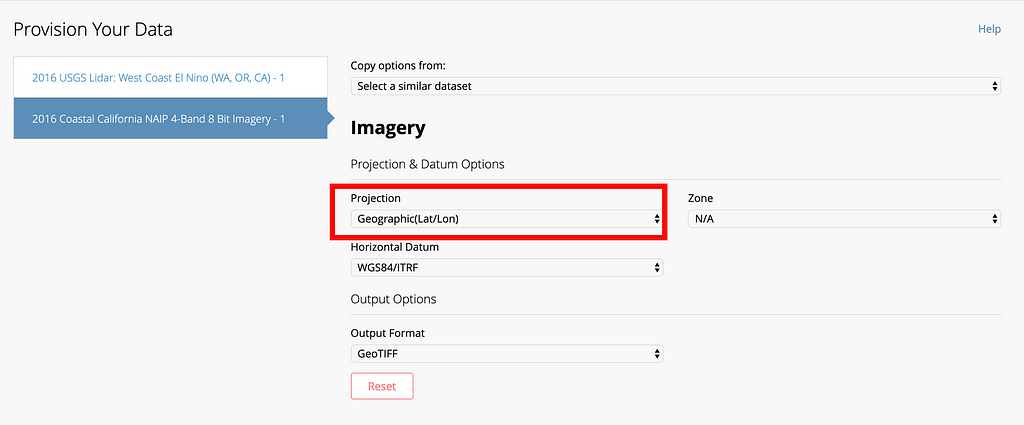
After you’ve done this, submit your order. You’ll receive two emails from NOAA with download links to the LIDAR and imagery files.
Now the fun begins, we can import the data into QGIS! Note, after unzipping both downloads, I change the file extension of the LIDAR to ‘csv’ — it comes as ‘txt’ by default.
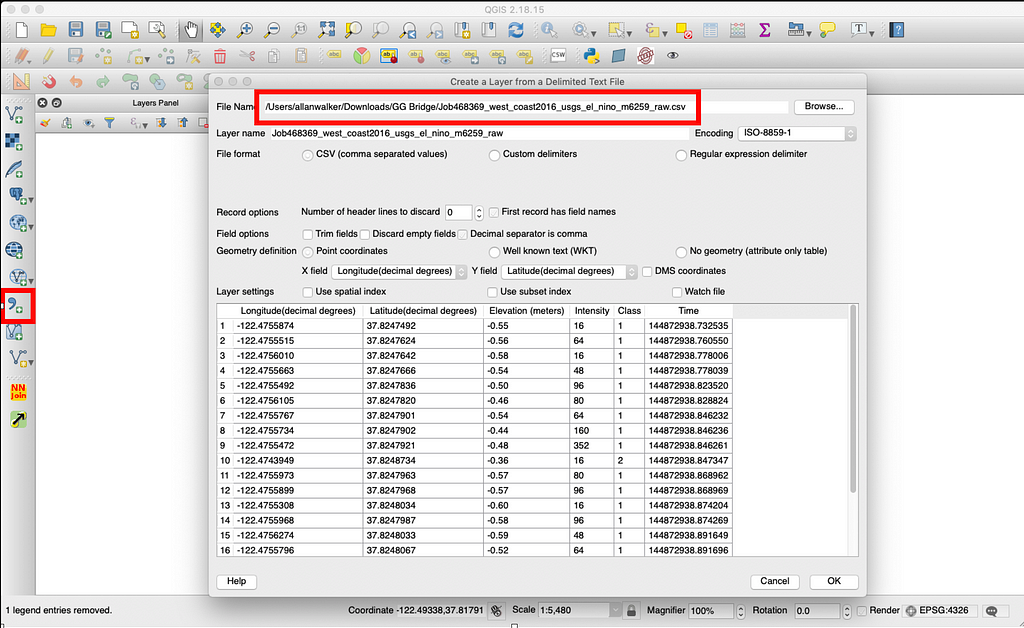
If you downloaded the same data as I did, you’ll get a lot of points, almost 5 million!
The goal is to filter this number to a reasonable amount of features and to render only what you need. I use a ‘Mask’ in this example below by creating a polygon layer and using the clip tool, and I also filter out elevation less than zero. When you are happy with your edits, save the file as an ESRI shapefile.

After editing the LIDAR data, it’s time to load up the imagery file into QGIS.
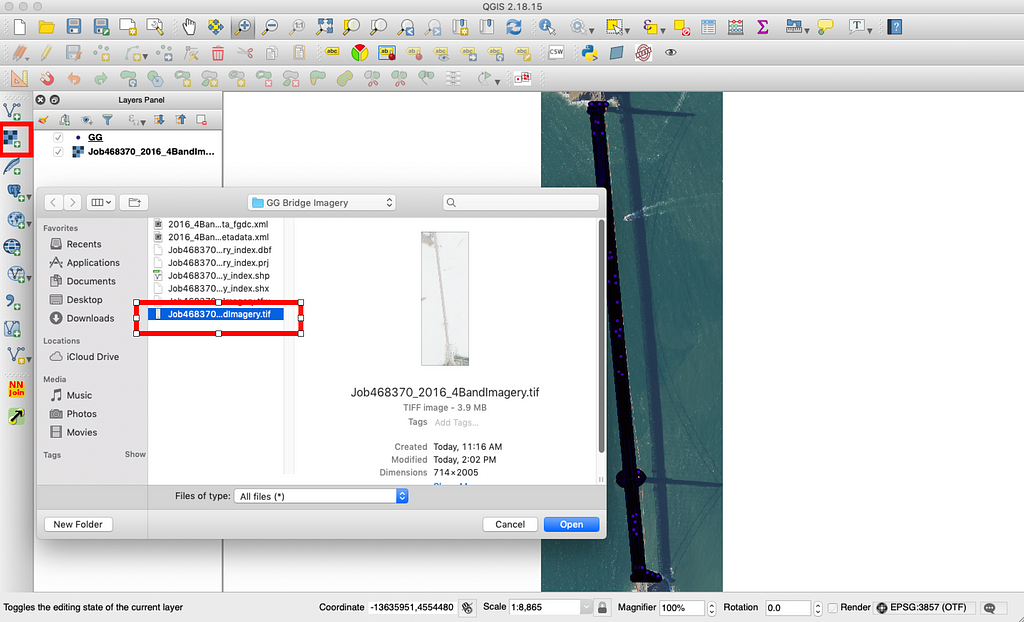
The first job is to save the Geotiff as a rendered image:
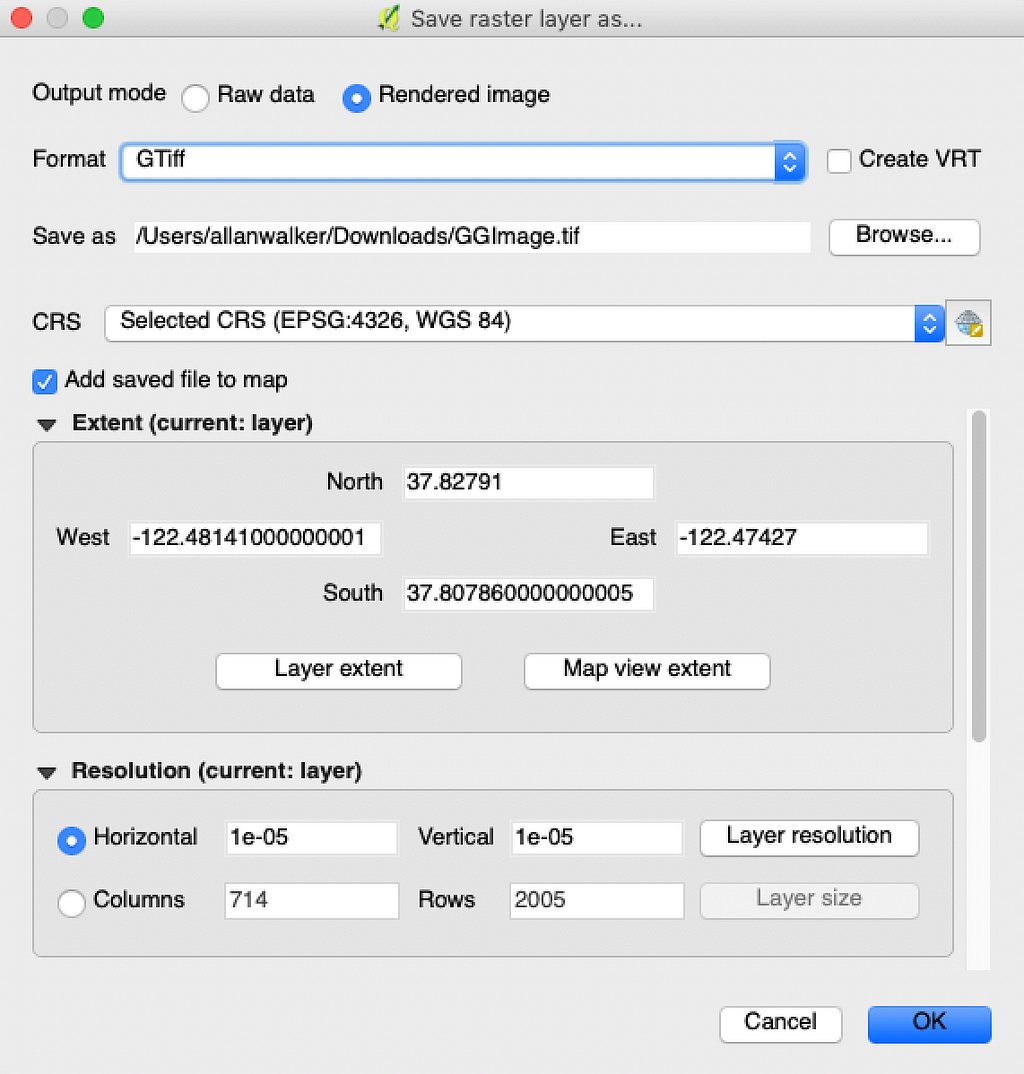
Now we are going to use a tool in the processing menu in QGIS: ‘gdal2xyz’:

And we run this tool as batch: we want to make 3 CSV files, one per channel, to get the Red, Green & Blue values for every latitude and longitude.
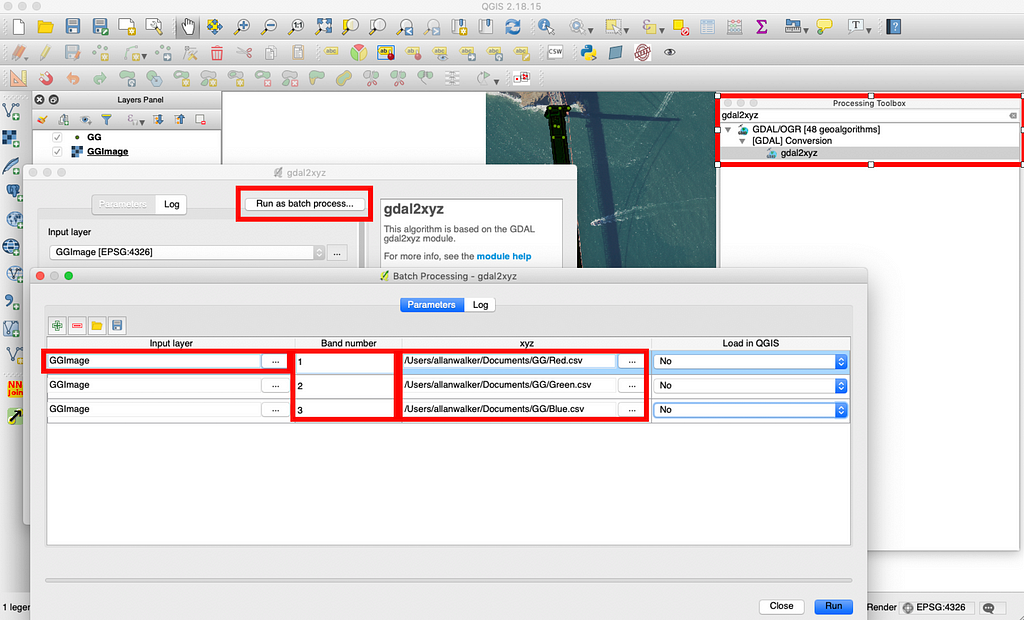
Load up the three CSVs you generated:
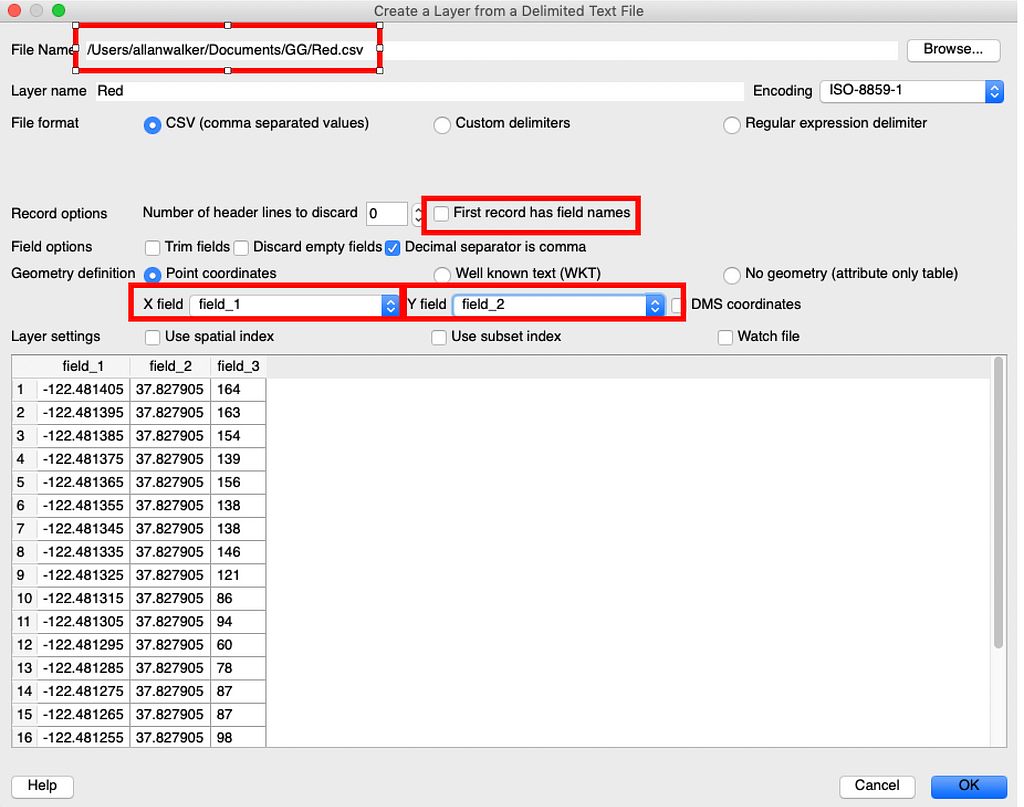
To make things a bit easier for myself, I change the field names in the files: in the LIDAR, I rename Longitude to X, Latitude to Y, Elevation to Z; and in the Red, Green and Blue CSVs I save them as ESRI Shapefiles and change Field_3 to Red, Green, & Blue respectively.
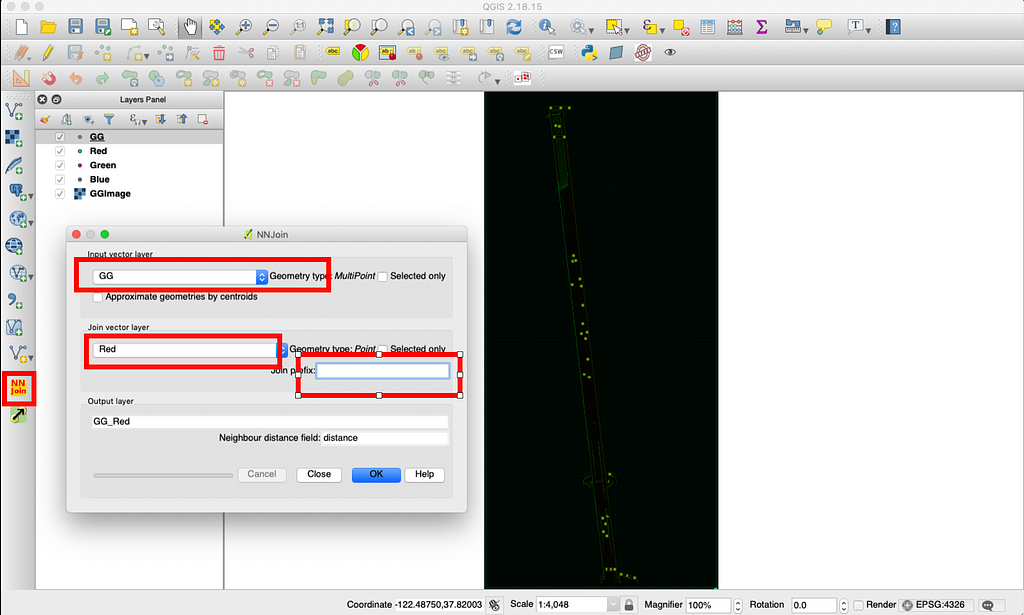
Then it’s nearest neighbor time. I use the ‘NNJoin’ plugin for QGIS for this. Basically, I’m going to add the nearest color value for every point in the LIDAR, so I have to do the join three times. The goal is to end up with the following attributes: X | Y | Z | Red | Green | Blue.
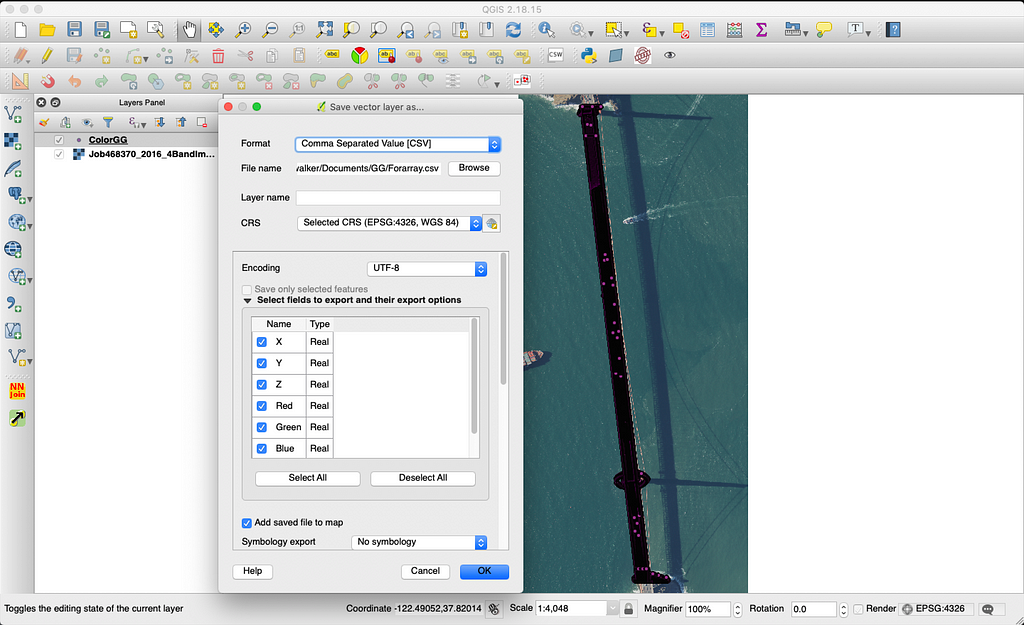
Almost there, let’s save the shapefile as a CSV so that we can approach the next step, building the array that Deck.gl will parse.
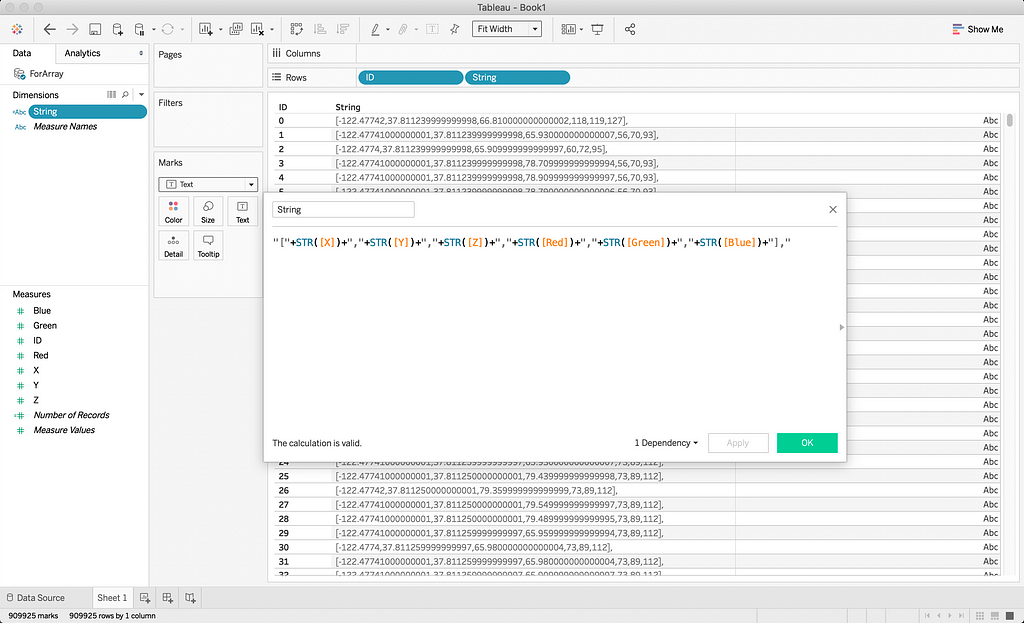
There are a lot of ways and tools you could use to build the array, I use Tableau, because it is what I'm used to. You could even build the array in QGIS using the field calculator. However, the basic principle is the same, we need a concatenated string. Something like:
"["+STR([X])+","+STR([Y])+","+STR([Z])+","+STR([Red])+","+STR([Green])+","+STR([Blue])+"],"
Now that you have built the array, prefix and postfix the array with a “[“ and “],” in notepad and save this as ‘array.json’. Save it to a CORS compliant website and share it, something like Dropbox should work.
I’ve added a boiler template to get you started!
The end result could be something like this:
Share what you build and reach out on Twitter if you have any questions — tag me @AllanWalkerIT and @mapbox.
Coloring LIDAR was originally published in Points of interest on Medium, where people are continuing the conversation by highlighting and responding to this story.