Building geospatial polygon visualizations for Real Estate investors
By: Austin Hale
Austin Hale is the Chief Technology Officer of Realeflow. Realeflow is a Saas company that provides CRM + other investing tools to residential and commercial real estate investors. After updating their new Leadpipe tool, he walked us through how he’s building with Mapbox.
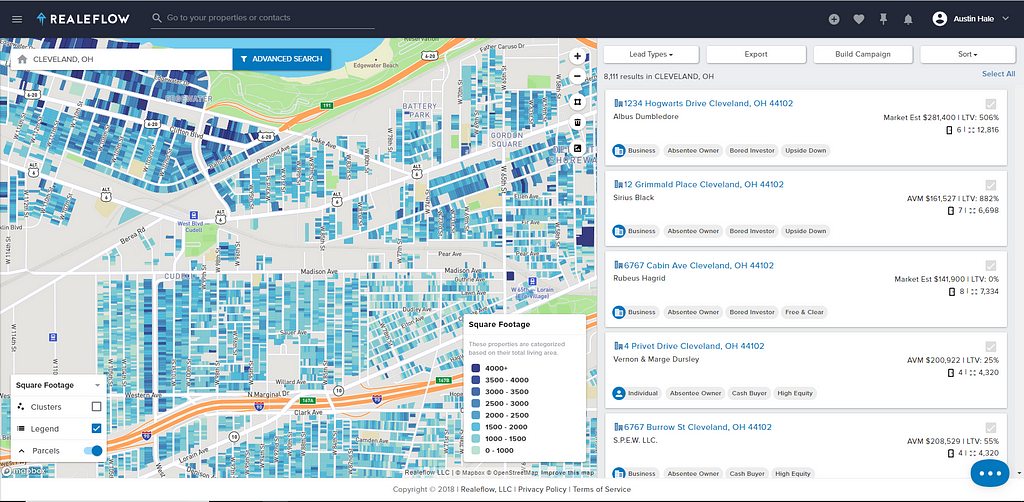
A few months back, our team at Realeflow decided to embark on an ambitious journey to combine geospatial polygons, i.e. the shape of a real estate parcel, with our nationwide lead data. For anyone who has worked with real estate data, you will know this is no small feat.
Value provided
Our Leadpipes tool allows investors to search with a myriad of different filters to create a lead list. Typically those investors will then either send out a direct mail campaign, use the list for targeted PPC marketing, or use some other marketing technique to get in touch with the owner of the property.
While we have improved the UX and added new data sets to Leadpipes, we wanted to find a way to visually represent what was happening in certain neighborhoods or regions.
For example, when searching a single property, we are able to provide the amount for which the property last sold, whether the USPS considers the property vacant, the estimated loan to value ratio, etc. However, that’s only shown for one property at a time. We wanted to showcase that data visually from a bird’s-eye view.
This is where Mapbox comes in.

If you’re not living as a technology-eschewing hermit in the middle of the forest, you’ve used a product that uses Mapbox. Snapchat, DoorDash, Foursquare, and The Weather Channel are just a few in a long list of services that utilize their technology.
If you’re a developer and you haven’t worked with Mapbox, you’re in for a treat. It’s an incredible experience. Mapbox has an amazing suite of tools that enables developers to create visualization layers on top of a base map. In our use case: real estate parcels and their corresponding property features.
The process
For our tool we needed to create visualization layers on top of a base map, like showing real estate parcels and their corresponding property features. To build this, there were a few things that really had to work well together:
- We had to create a unique address identifier for every address in the U.S. and properly match them with their corresponding parcel & data.
- Create a GeoJSON file that includes all of the polygon + data features that we wanted to display. This has to be updated daily.
- Create an MBTile (Mapbox format, essentially SQLite) using the Mapbox tippecanoe library to dramatically reduce the GeoJSON file size, enabling us to show a nationwide visualization.
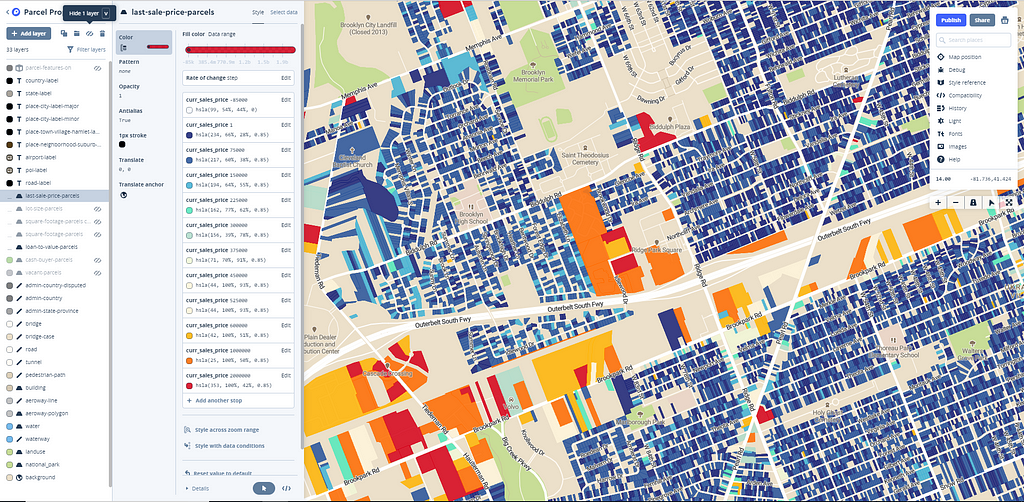
- Create visualization layers using Mapbox studio and implement them on top of our existing Leadpipes tool.
The future
While we’re very excited about what we’ve released so far, this is only V1. In addition to adding more data, improving the UX with user feedback, and making the tools more mobile friendly, I’m also able to announce two new features that we’ll be adding in the next month or two. It’s probably easier to show the proof of concept as opposed to trying to describe them.
3D Parcel Extrusions
Time Slider
We’re excited to continue innovating and adding value to the real estate investment space and we’re grateful to be able to work with amazing partners like Mapbox.
This post originally appeared on Austin Hale’s blog. If you want to start building with Mapbox, signing up for an account and getting access to Studio is free. If you’re a real estate investor or programmer and have ideas on how to make this even better, reach out to Austin on Twitter.
Realeflow + Mapbox was originally published in Points of interest on Medium, where people are continuing the conversation by highlighting and responding to this story.