By: Sam Gehret
New release alert — the Mapbox Visual for Power BI, a plugin to use our visualization tools directly inside Microsoft Power BI, is now available.
In March we launched the Mapbox Visual for Power BI Preview, which included features like heatmaps, cluster aggregations, and custom map styles. Power BI users created some compelling visualizations with the preview:
Already enjoying the new @Mapbox custom visual for @MSPowerBI ... This is awesome and FAST! #PowerBI
Firefly cartography... @John_M_Nelson titled a post "Steal This Firefly Style Please", so I recreated this in #PowerBI. https://t.co/3jBkHHxM7z Here's the effect for the new Mapbox custom visual. No option for gradient in ArcGIS Maps for Power BI at this stage though.
We asked for your input on what we should build into the plugin next, and — wow did we get feedback! The new version now incorporates many of the features you requested. Here’s a rundown of some of the top requests that made it into this release:
Support for Safari, IE11, and Edge
Our top requested feature was support for more browsers and devices. We now support most major browsers including Safari, IE11, and Edge. You’ll now have the same experience viewing dashboards in Power BI Desktop as you do on iOS Devices.
Clik here to view.

Support for choropleth maps and drilling
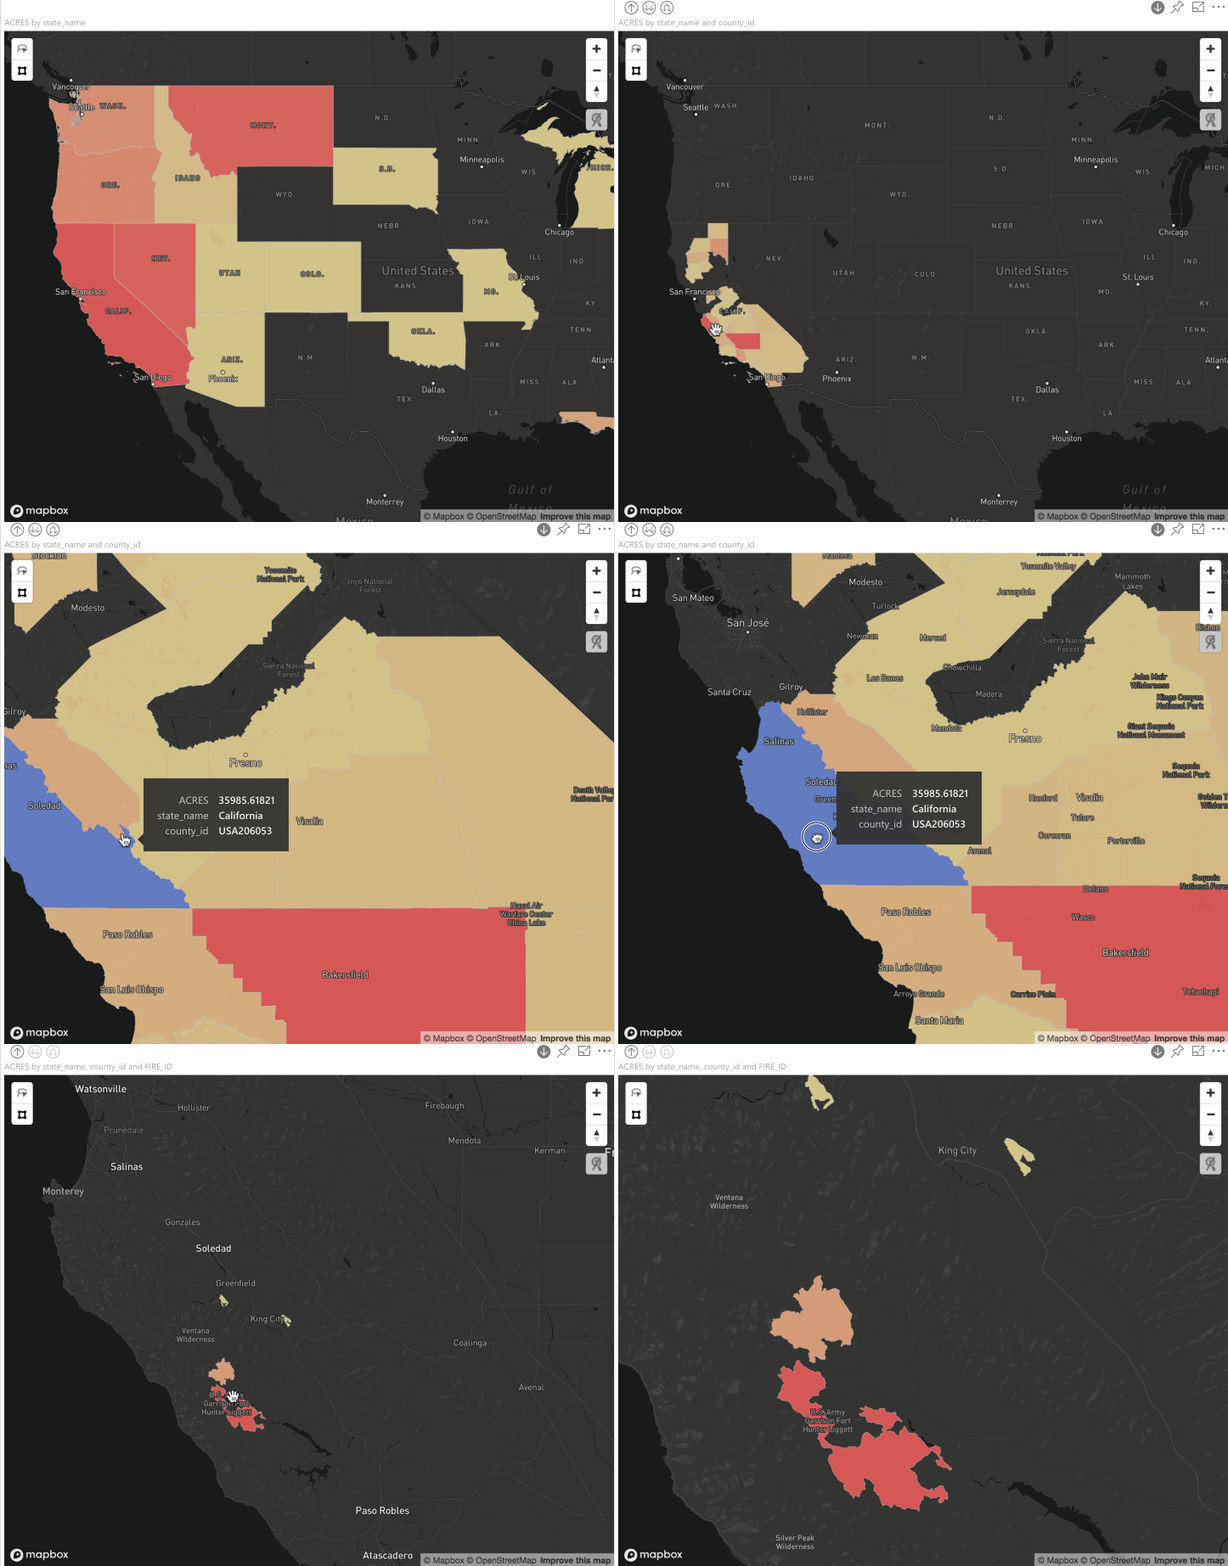
You’re now able to add choropleth (fill) layers to multiple layers in your map and then drill down between them.
Clik here to view.
Custom boundaries
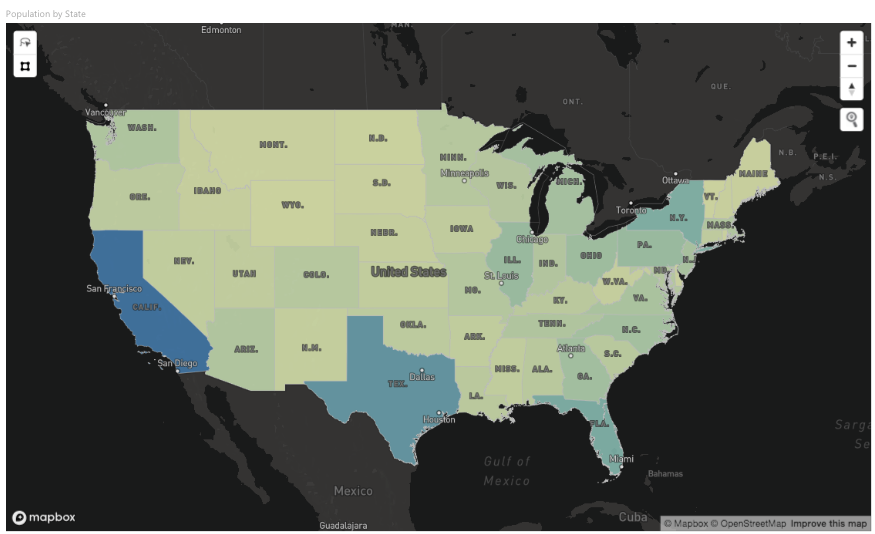
The new plugin also ships with boundary definitions for countries of the world, US States, and US postal codes. Administrative and postal boundaries for over 200 countries are available upon request. Use open source boundary definitions by uploading files to https://www.mapbox.com/studio/tilesets/ and connecting to your Mapbox visualization in Power BI.
Clik here to view.
Lasso selection and data wrangling
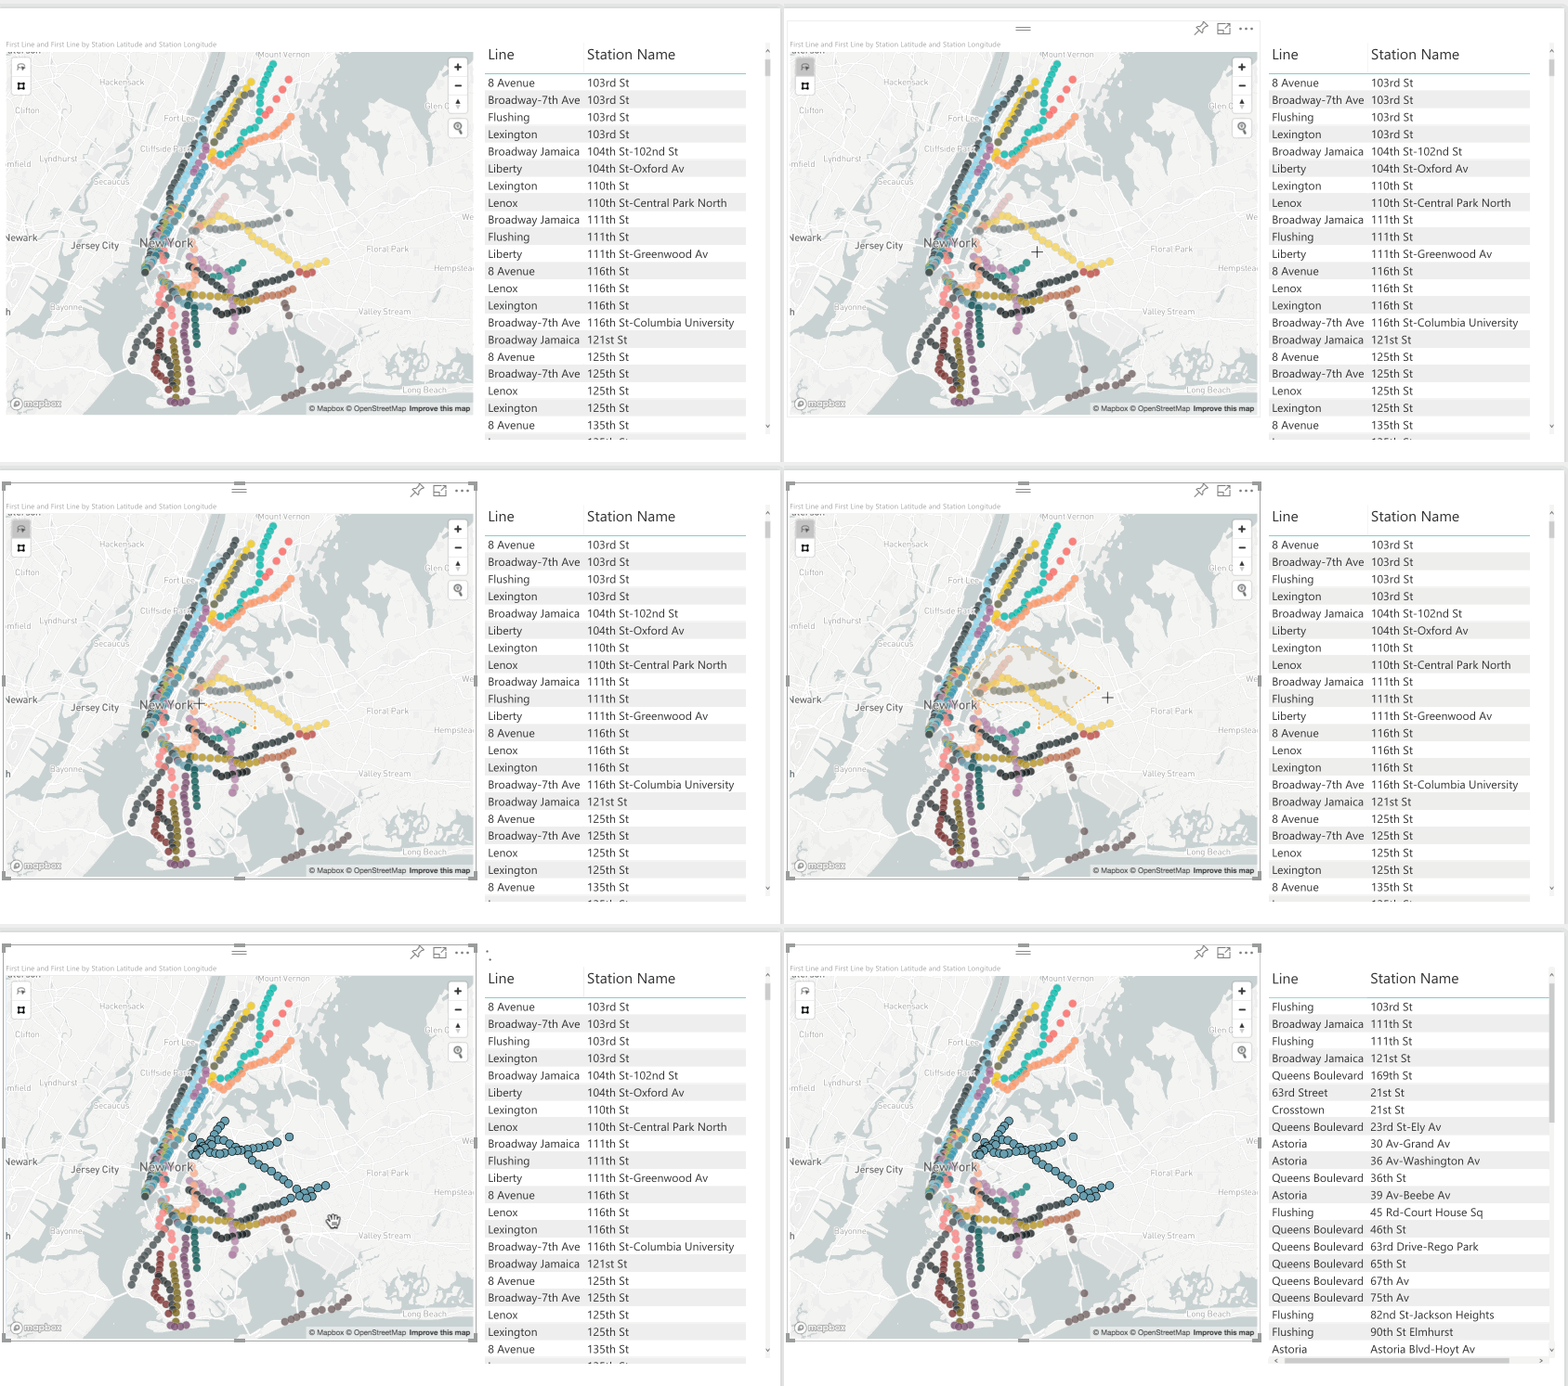
Community members asked for more tools to make it easier to handle large datasets. So we’ve added our new Lasso tool. Use the lasso to select and analyze the data points which are relevant to you.
Clik here to view.
Cross-highlighting and filtering
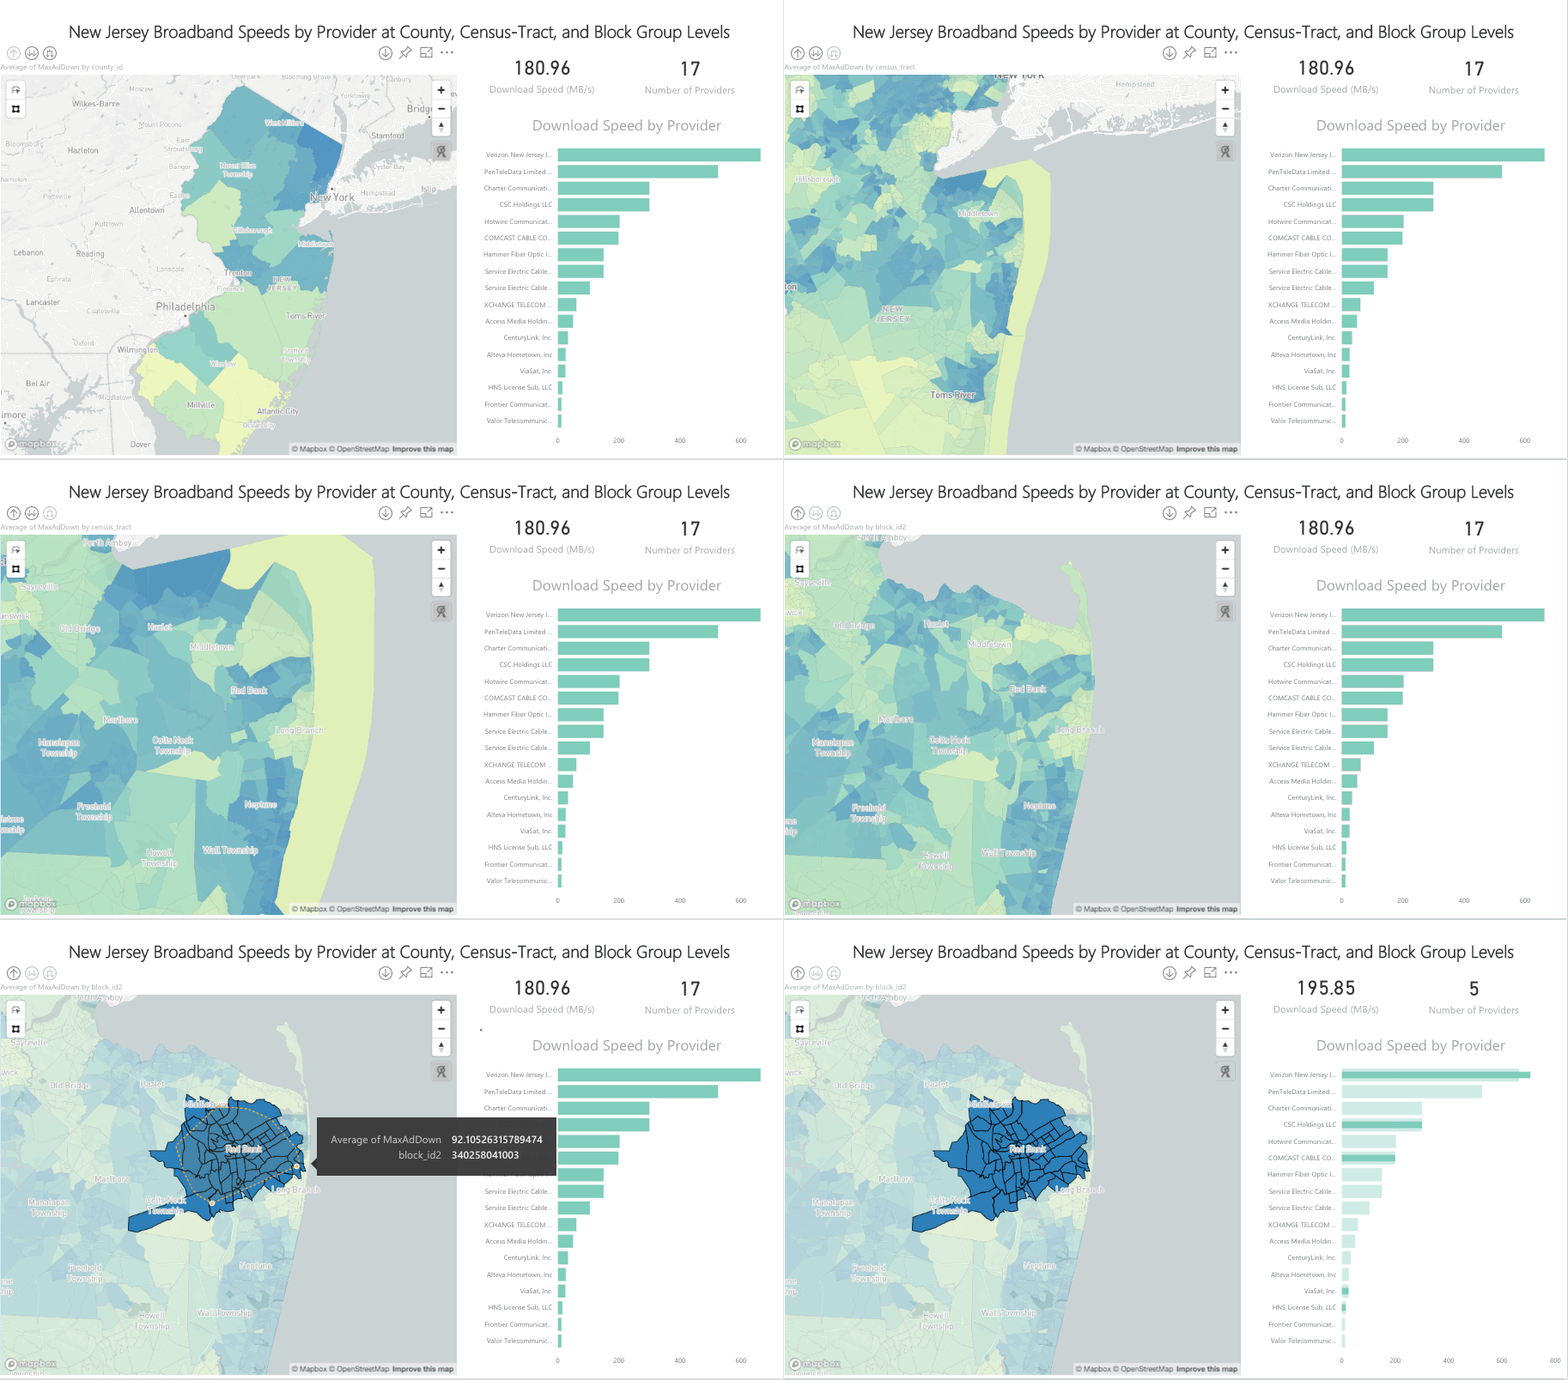
Making selections on the map will now drive the other visualizations on the dashboard. Trace geographies and watch dashboards react in a flash to your new parameters.
Clik here to view.
Getting started
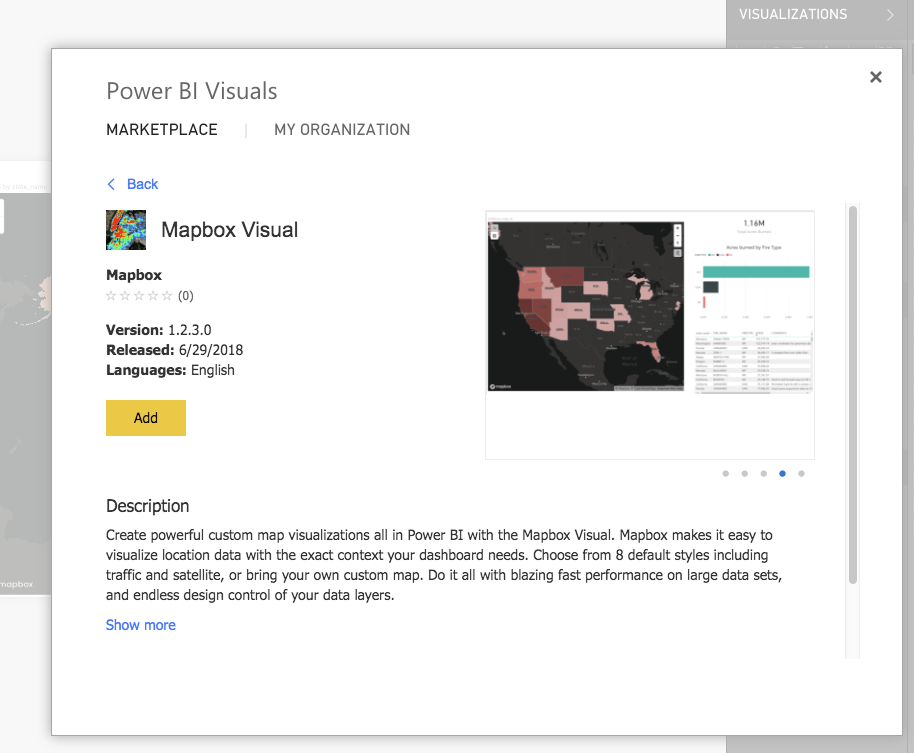
To start using the Mapbox Visual for Power BI, you’ll need to get a Mapbox account and a Power BI account. Grab the Mapbox Visual for Power BI from the Microsoft Office Store. Just click “add from marketplace” and search “Mapbox”.
Clik here to view.
If you’re a business interested in a more customized business intelligence solution, drop us a line.
Image may be NSFW.Clik here to view.
Mapbox Visual for Power BI upgraded and generally available in the Microsoft Office Store was originally published in Points of interest on Medium, where people are continuing the conversation by highlighting and responding to this story.