By: Erin Quinn
Bust out your 🏳️🌈 rainbow flags 🏳️🌈 — it’s Pride Month. Across the globe, people are commemorating the 1969 Stonewall riots in Manhattan and the larger societal contributions of the LGBTQ community. This June, Pride Parades are happening all over the world — from San Francisco to Zagreb (and even Antarctica!).
To celebrate, use some of our new features to dress up your maps, Pride style.
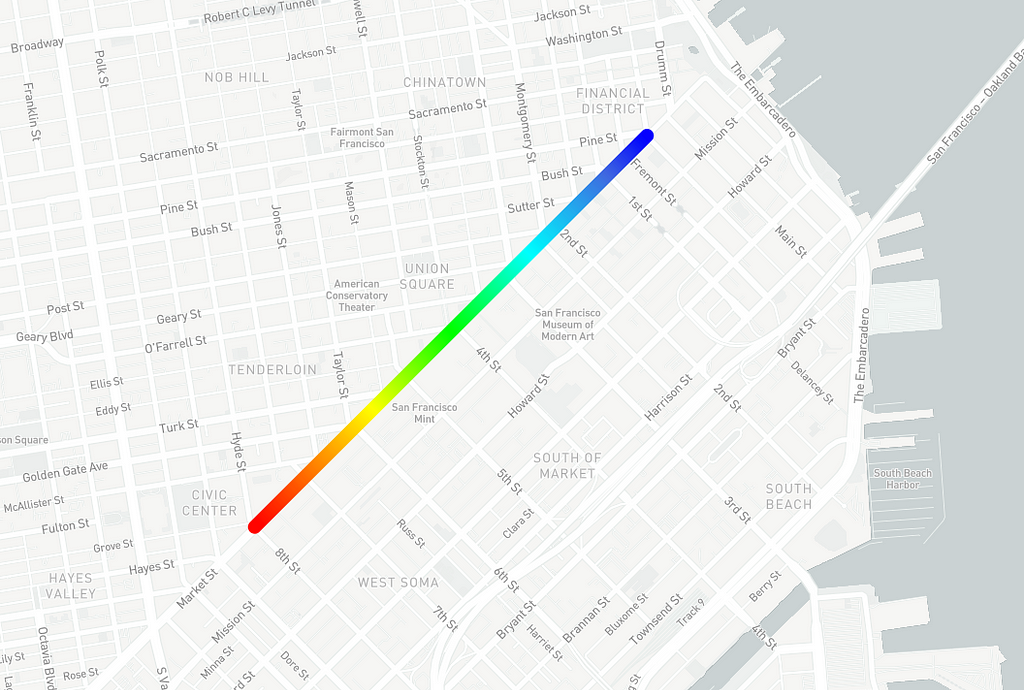
Line gradients for parade routing
Our new line-gradient property for GeoJSON in Mapbox GL JS lets you paint color gradients into lines on the map using expressions. Meaning the line dynamically changes based on properties you set. Use line-gradients to animate rainbow parade routes or show the progress of the parades.
Here’s a static line gradient route:

You can also animate route lines:
And you can animate a gradient line to show a parade’s progress along a route:
Check out this example to learn more.
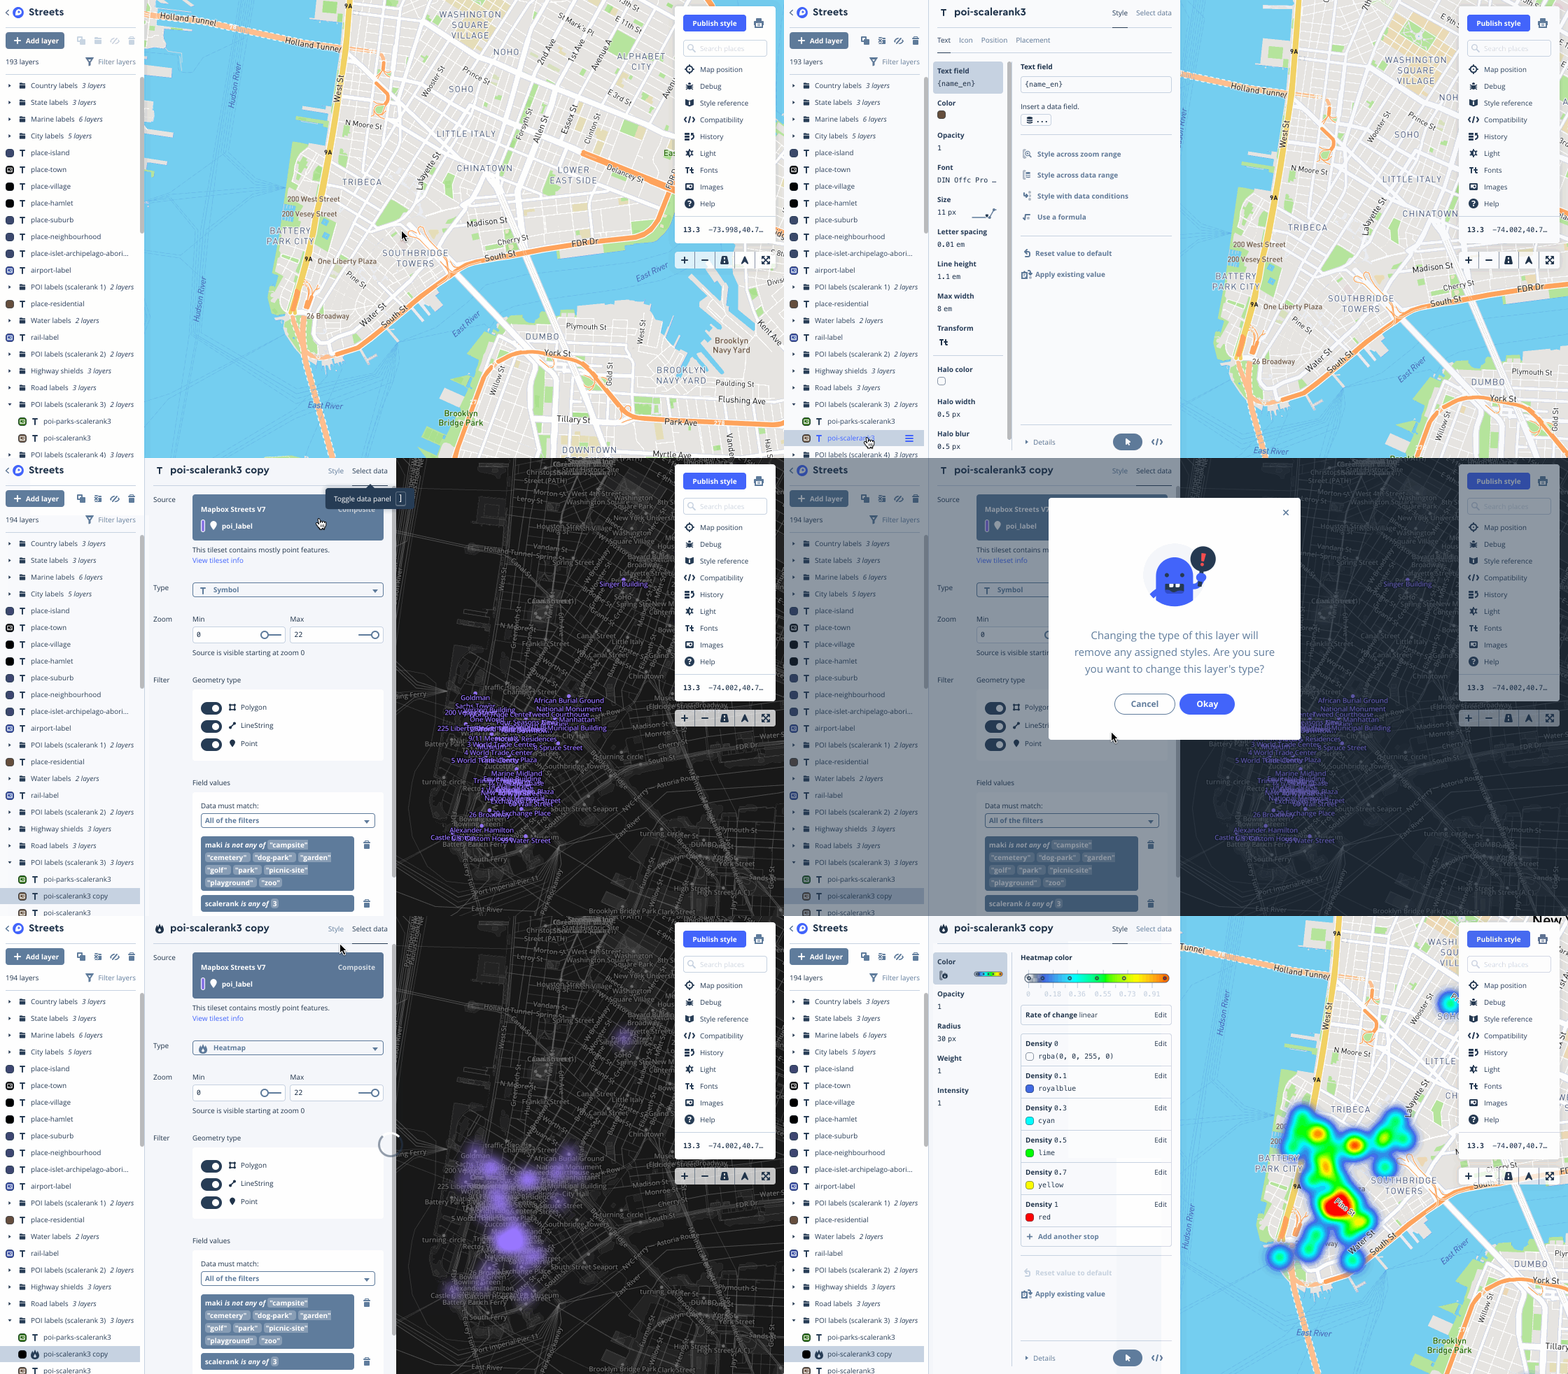
No-code heatmaps
Easily prototype heatmap properties of weight, intensity, color, radius, and opacity without writing code with our newly launched heatmaps in Studio. Upload your own datasets or use existing layers in Studio to create heatmaps (from the select data tab). You can customize the colors to reflect your favorite rainbow hues.

Patterned line layers
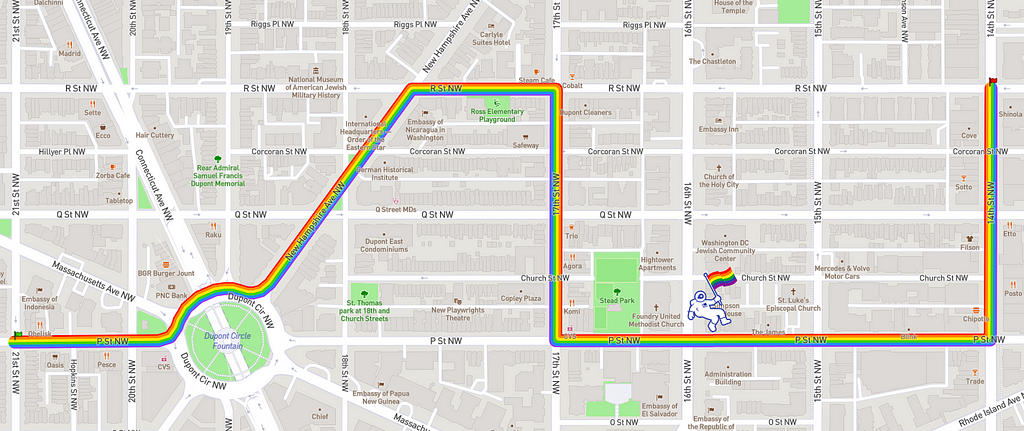
You’ve been able to do this one for a while with our tools, but it’s just too good not to highlight. Our own AJ Ashton illustrated the DC parade route last year in Studio using a Rainbow SVG icon as a pattern for the line layer:

To make your own themed parade route, start by tracing the route as a line in the Dataset Editor. Then export that dataset to a tileset and add to your style of choice as a layer. In the Style Editor, upload an SVG to your images panel, and select the SVG as your pattern for the line, setting width to 20px. If you’re working with multiple parade routes, create unique datasets for each and take advantage of bulk editing (the shift key allows you to select multiple layers).
We’re celebrating this month in our offices with panels of our LGBTQ team members sharing their professional experiences. After the panels and parades are finished, we encourage you to support one of the many organizations dedicated to the LGBTQ community — particularly LGBTQ youth, whose risk of experiencing homelessness is 120% higher than their peers. These organizations include but are not limited to:
- SMYAL in Washington DC
- Lyric in San Francisco, CA
- SMYRC in Portland, OR
- Aliforney Center in New York, NY
Happy Pride, we’ll see you out there!
Map Pride 2018 with our new design tools was originally published in Points of interest on Medium, where people are continuing the conversation by highlighting and responding to this story.