By: Emily DuBois
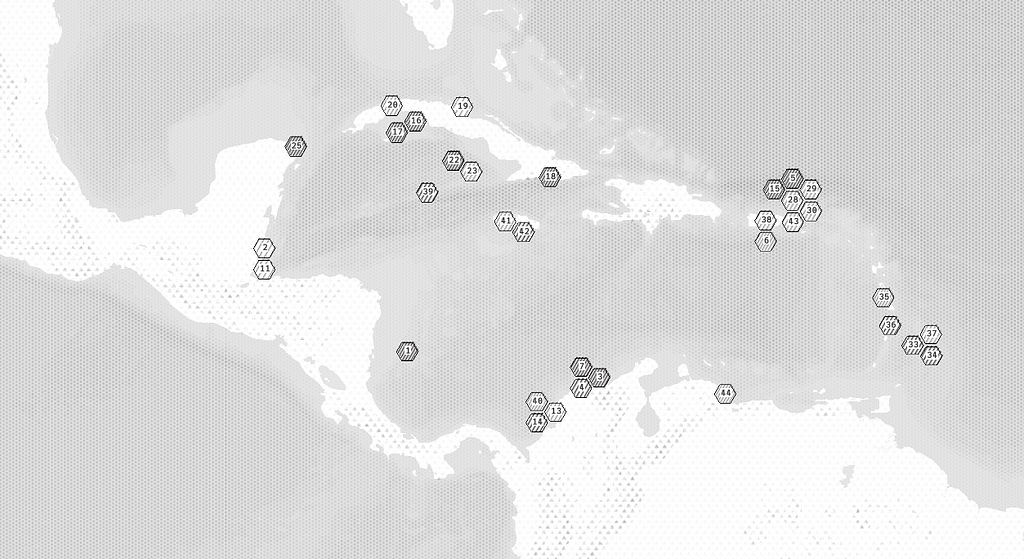
Our latest map style, Carson, illustrates how to visualize geographic data over a map image for black and white print. The design is inspired by the fill patterns used in scientific journals. Explore the map.
The inspiration
Two years ago, I was authoring a paper that sought to better understand how corals respond to seawater temperature anomalies in the context of their assemblages. To help demonstrate our conclusions, I needed to place some styled markers on a map. The process involved Mapbox.js, Mapbox Studio Classic, Adobe Illustrator, and some painstaking data updates.
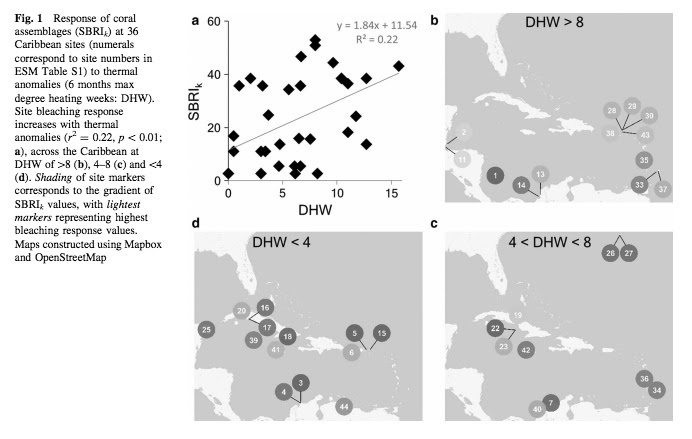

Now, with the dataset editor and new high-resolution print feature, these figures can be managed entirely within Mapbox Studio. While recreating the above images with these new tools, I wanted to develop a style compatible with black and white journal specifications that’s also consistent with the types of fill patterns used in neighboring charts and diagrams.
Behind the design
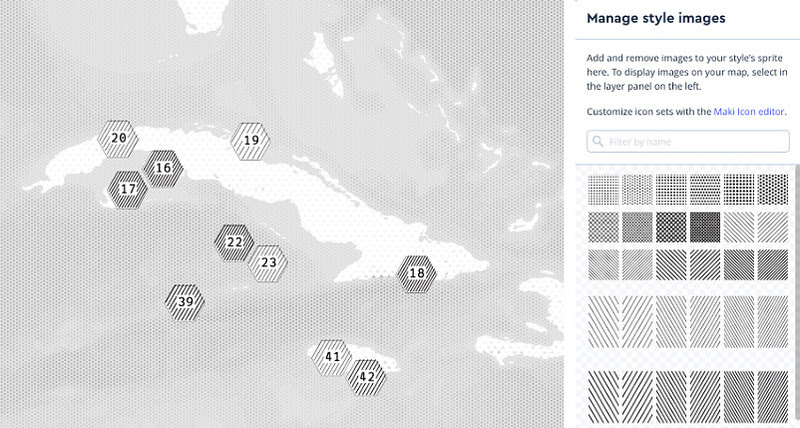
Carson is a simple grayscale style with an SVG fill pattern starter pack. The inclusion of subtly-styled hillshade and bathymetry data sources afford visual depth while keeping the focus on the data. I’ve also included the dataset used to create the original paper figures to exemplify how you can use fill patterns for your data visualization. Explore the corals-prefixed layers to see how you can leverage source data filtering on GeoJSON properties and layer grouping to visualize multi-dimensional data.
The process
I used the open-source hextile library to generate hexagons for each of my data points and loaded the resulting GeoJSON features into Studio’s dataset editor where I tweaked feature placement. Each datapoint was then categorized by dhw, which determined the layer group it belonged to, and sbri, which determined the polygon fill pattern. I exported my dataset to a tileset and added the tileset to the style. In the style editor, I created a layer for every unique dhwand sbri value combination and grouped the layers by their dhw value.
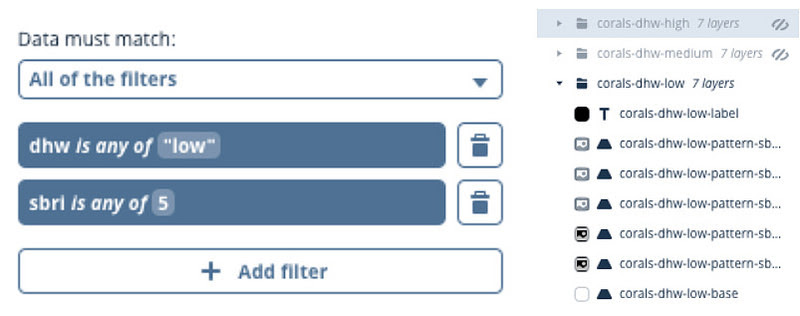
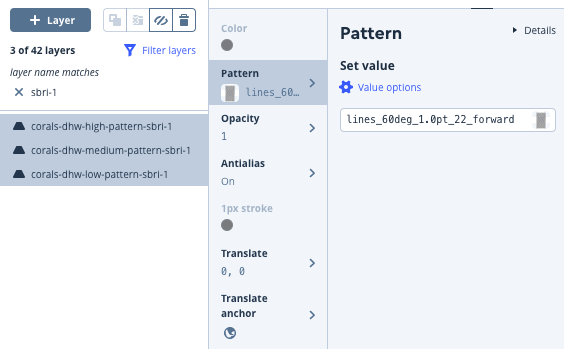
I then used the Filter layers feature to apply the same fill pattern to all layers with the same sbri value.
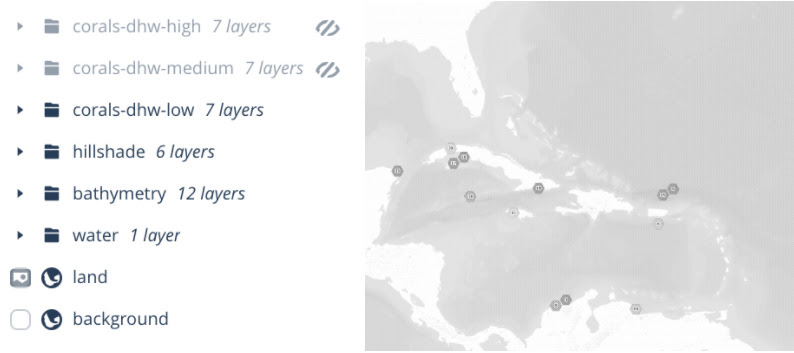
Finally, I used the high-resolution print feature to export 3 images, each with only one of the coral data layer groups visible, to replicate the maps in the original paper.

Add Carson and start customizing your map in Mapbox Studio. Choose from more professionally designed map styles by our cartography team or create your own.
Carson: A map style inspired by scientific journals was originally published in Points of interest on Medium, where people are continuing the conversation by highlighting and responding to this story.