Viewing 150 million features with dynamic Tableau dashboards
By: Allan Walker
Escaping Flatland
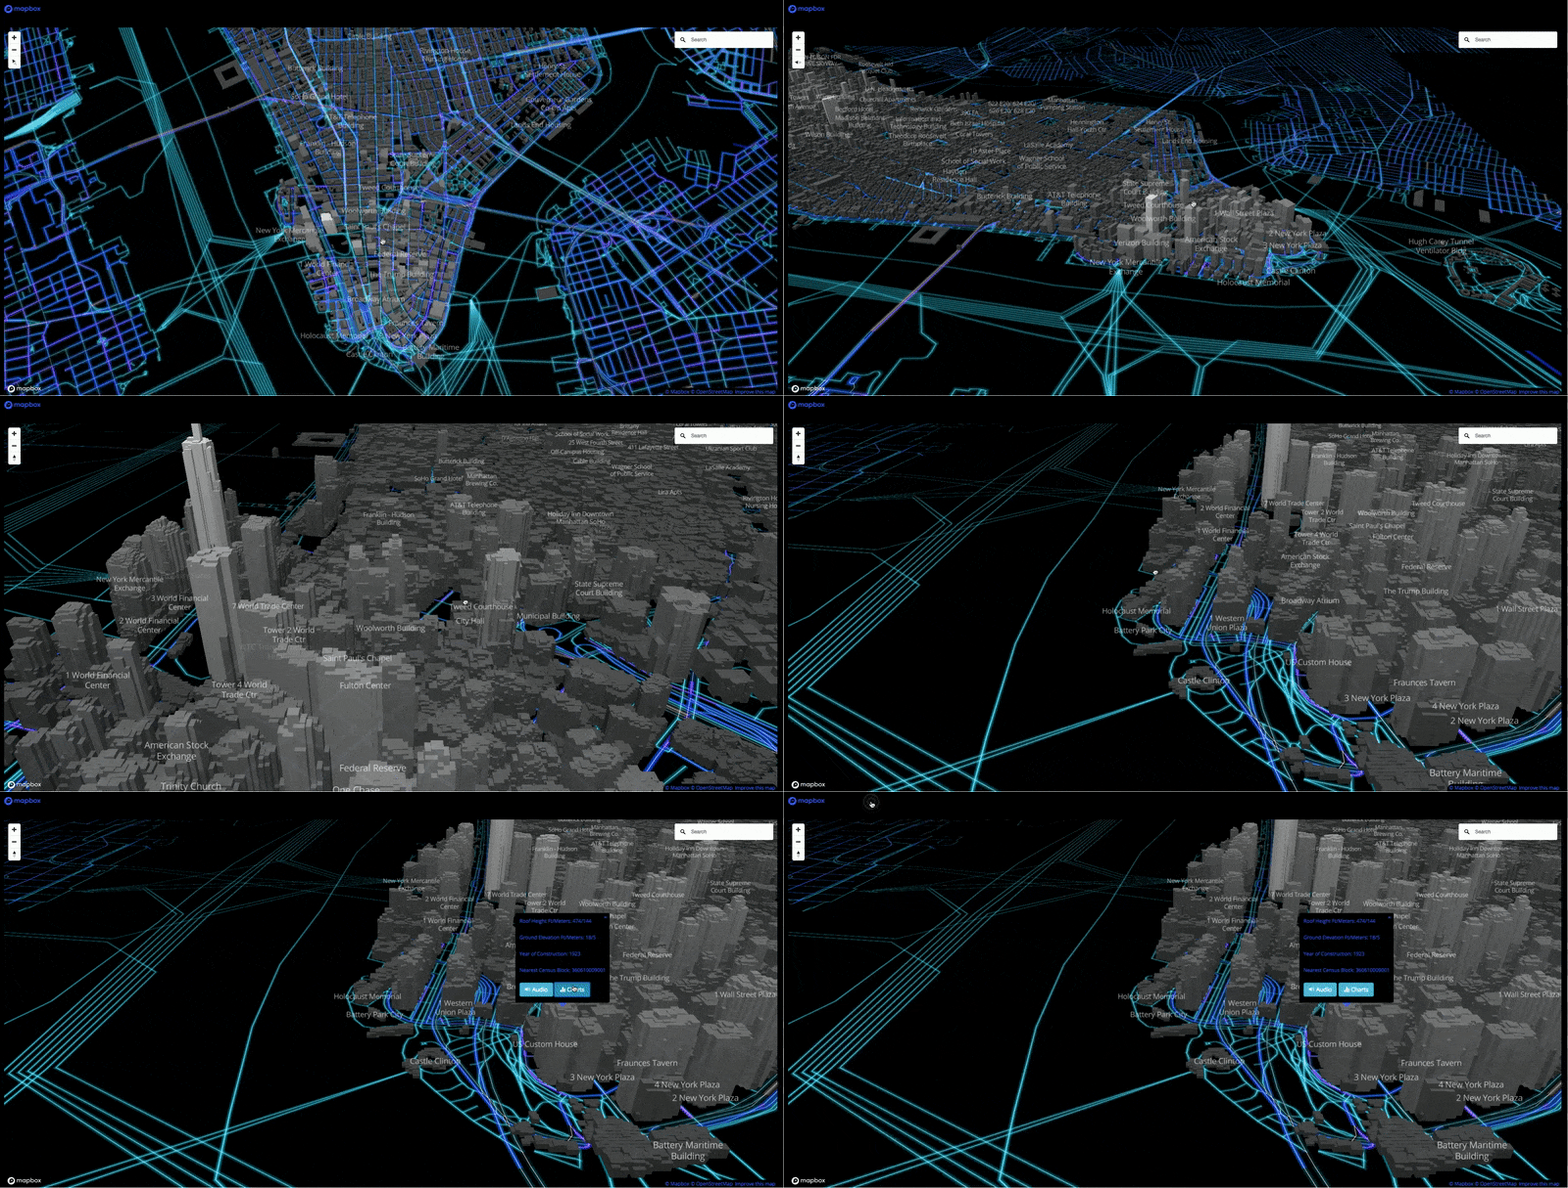
LIDAR lets us see super detailed 3D buildings, and when we place it on the map we have a powerful context for data analysis. With Mapbox GL, we can pan, rotate, pitch, and zoom taking full advantage of the detail LIDAR provides. The performance is stunning, rendering 150M features with dynamic Tableau Dashboards & Text-To-Speech (TTS) Popup Tooltips.

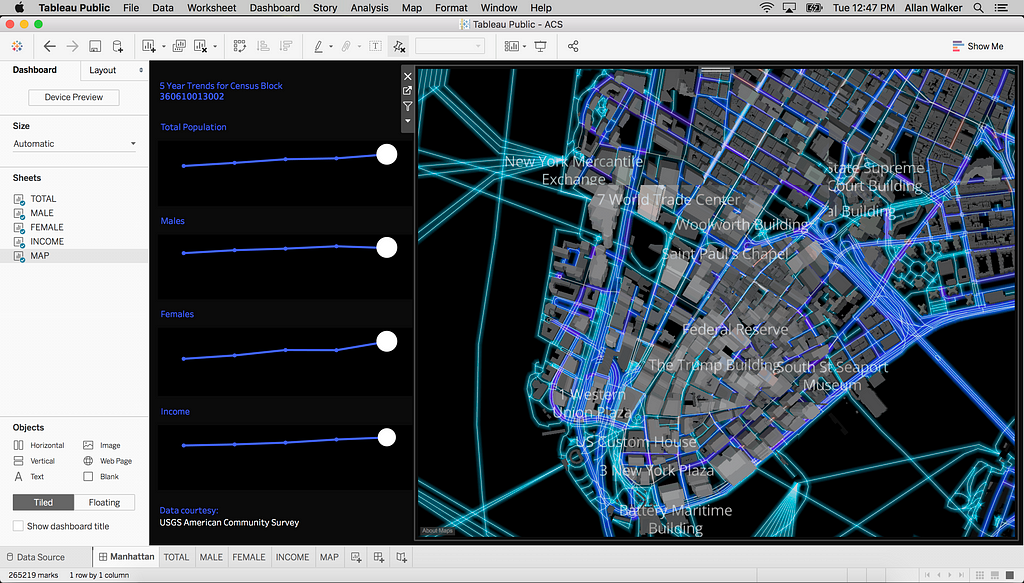
You could easily flip this to 2D: Below is a Tableau Public dashboard that has the same integrated Mapbox Studio style, but you lose the ability to use the full power of GL.

To add LIDAR to your Tableau Dashboard follow my recent tutorial, or hit me up on Twitter @allanwalkerit with any questions.
LIDAR Maps with Tableau was originally published in Points of interest on Medium, where people are continuing the conversation by highlighting and responding to this story.