By: Allan Walker
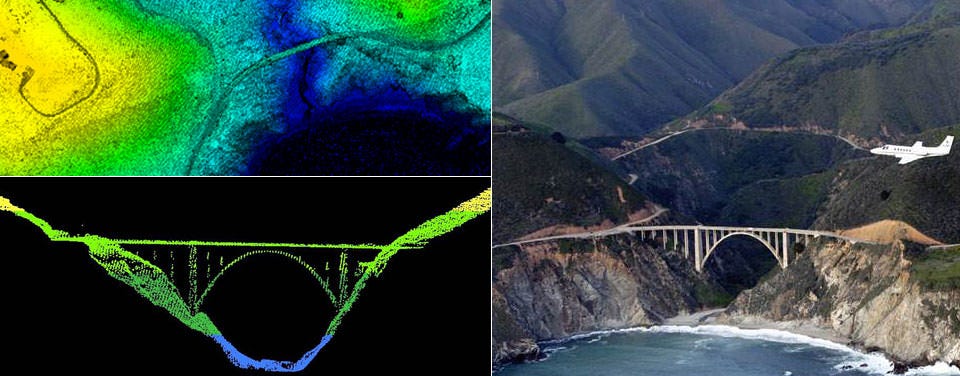
Here is a quick step-by-step approach to working with LIDAR data in Mapbox, bringing high resolution detail to your maps. LIDAR data is often collected by air, like this NOAA data collected by a survey aircraft over Bixby Bridge in Big Sur, California (image right). Here, LIDAR data reveals a top-down and profile view of Bixby Bridge (top left). LIDAR collects this high resolution data via a pulsing laser that measure ranges (variable distances) to the Earth, creating three-dimensional information.
I’m excited to use LIDAR because it can deliver a higher resolution and an even higher level of detail to my maps!
1. Get some LIDAR!
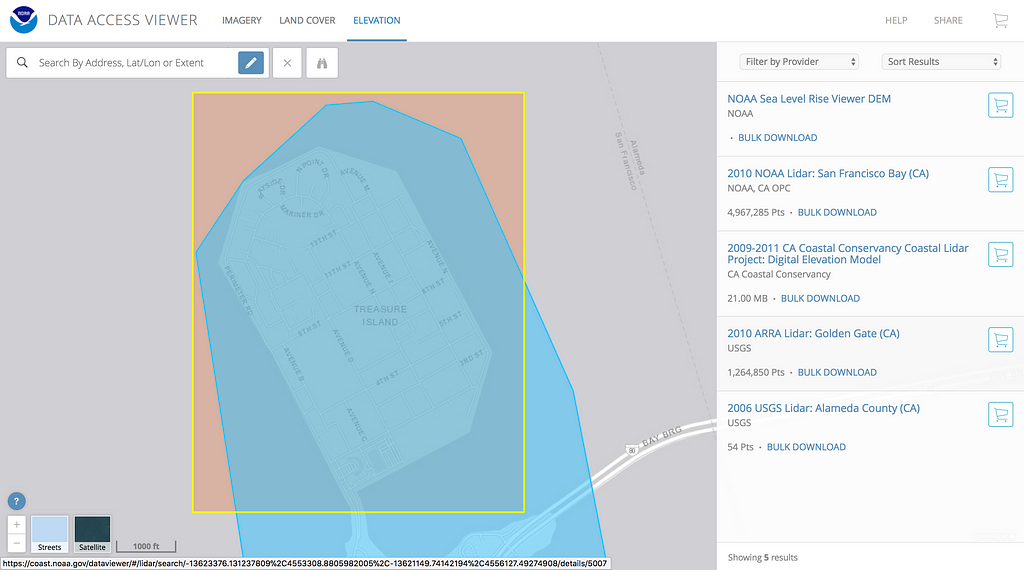
If you don’t have your own LIDAR data, head to NOAA’s website and download their open data. For this demonstration, I tried Treasure Island & Yerba Buena Island, California:
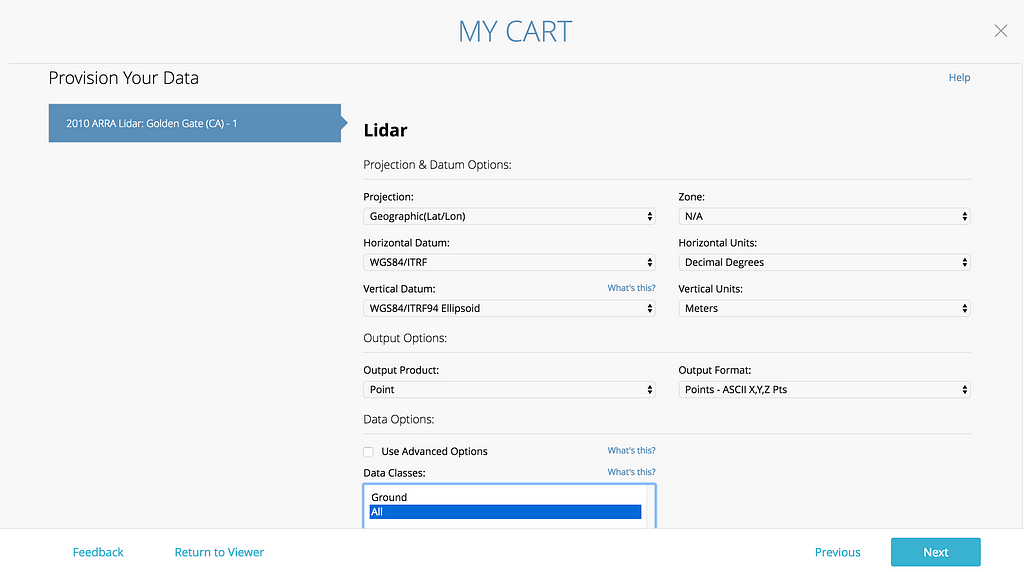
Then, make your choices:
2. Ingest LIDAR into QGIS
Open the ASCII XYZ.txt from the download link with the Menu → Layer → Add Delimited Comma Layer. This will look like lots and lots of dots on a map, usually in a square grid, and it’s a good time to save it as a geospatial file, such as ESRI SHP or GeoJSON.
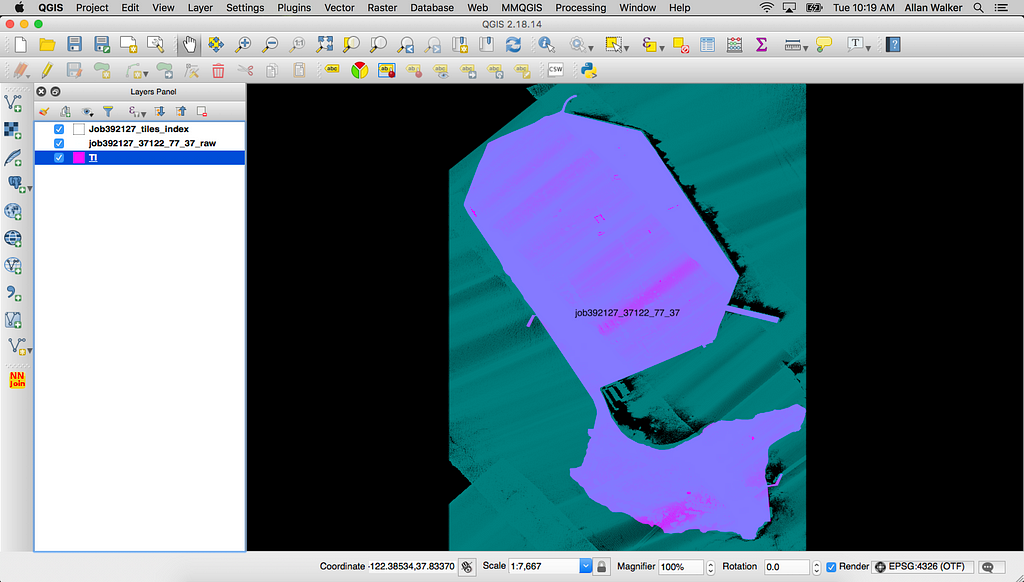
3. Intersect LIDAR
To get the points we need, we will use the Menu → Geoprocessing Tools → Intersect tool. We’ll use the ESRI SHP or GeoJSON file that you saved in step #2 as the input file, and a SHP or GeoJSON file of the area of interest (in this example, Treasure Island & Yerba Buena Island) as the Intersect Layer. Just be sure that the projections are the same. I normally stick to WGS84: EPSG:4326.
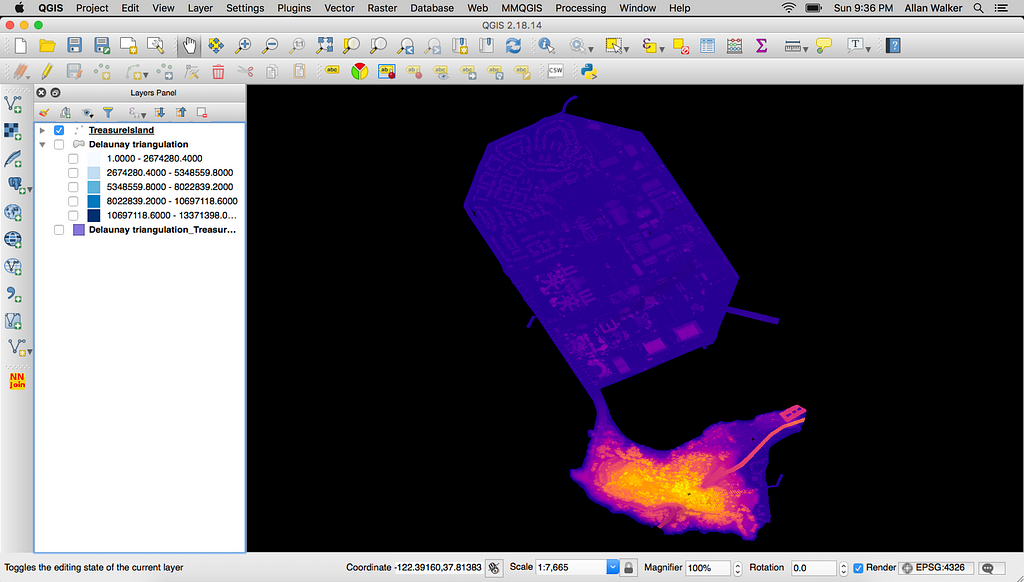
After clicking Properties → Style → Column → Elevation and setting a Color Ramp, you’ll get something like this:
4. My first attempt — using buffers
The first process I tried was to use Menu → Vector → Fixed Distance Buffer, using a UTM Zone Projection (In my first test, I used EPSG:32618 18N for New York, as I had picked Manhattan as my selection above) with a buffer distance of the Nominal Point Spacing of the LIDAR (in this case, 70cm, which was described in the metadata link).
After re-projecting back my buffered Manhattan GeoJSON file to EPSG:4326 and uploading to Mapbox Studio, I added my Tileset as a Fill Extrusion layer to a style, and set the height (and color) based on “Elevation”.
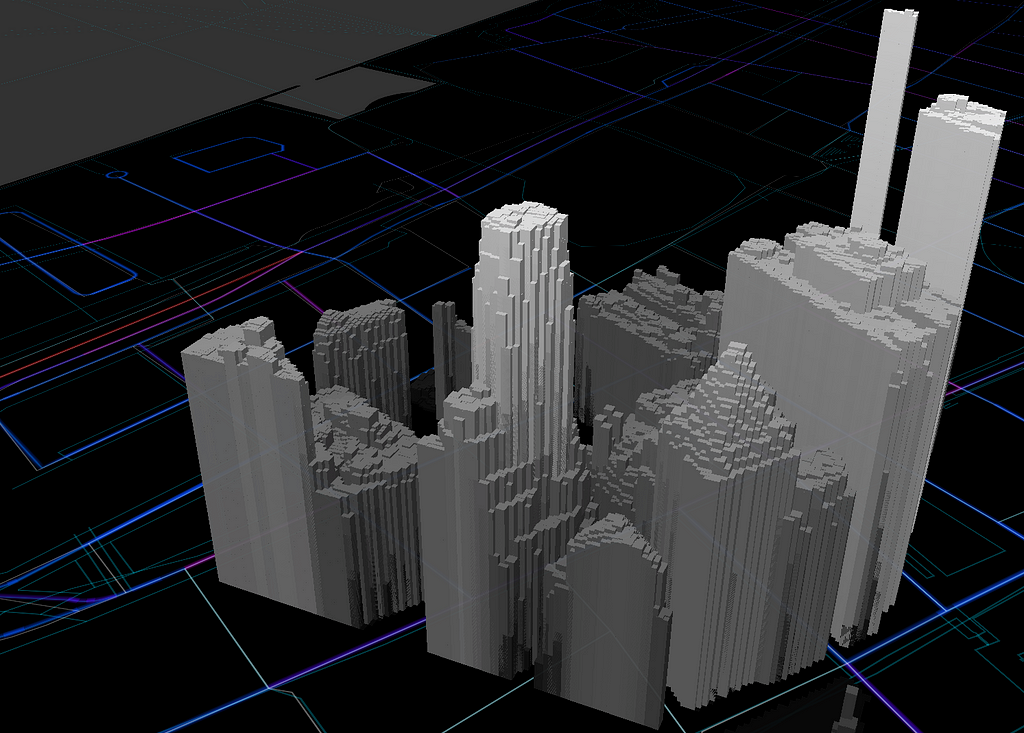
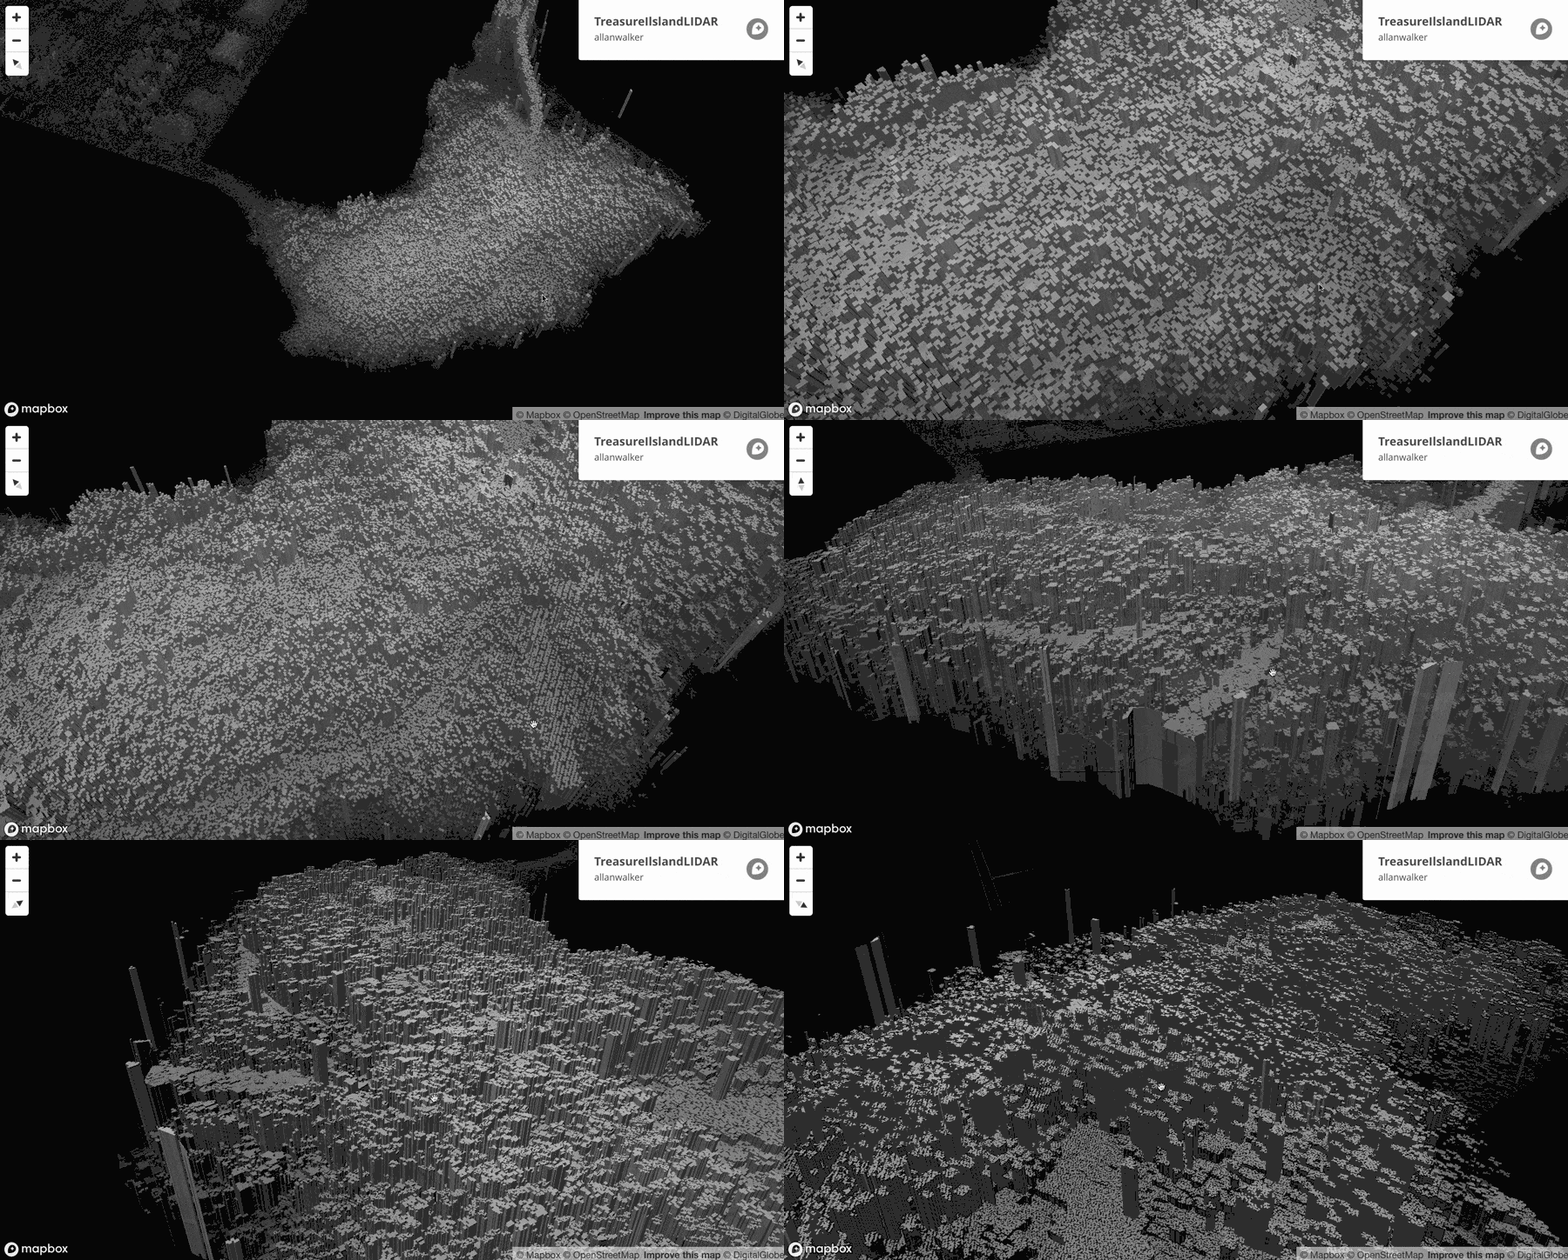
I was more than happy to see some pretty detailed buildings, but this was still too much like Lego. Or as my data-viz-partner-in-crime, Anya A’Hearn put it — maybe more “Minecraft-ish.”
So how can I improve on this, while making it a scalable, repeatable process? Well, let’s look back to our original example of Treasure Island.
5. Delaunay LIDAR
Instead of buffering the points, we’ll use a technique called Delaunay Triangulation: in QGIS, this can be done via the Menu → Vector → Geometry → Delaunay Triangulation or Processing → Grass v.delaunay tools.
I won’t go into the mathematics here, but basically, it’s a way to tessellate the points, creating triangles (which have three edges, or vertices) rather than a buffer, which have a minimum of four. So at the very least, I won’t be dealing with overlapping, multi-edged polygons; but I’m now into the realms of Triangular Irregular Networks and meshes.
Splines, Nurbs, Bezier surfaces…all very Unity, or Rhino, or Blender, oh my! Anyway, here’s the output of the process in QGIS:
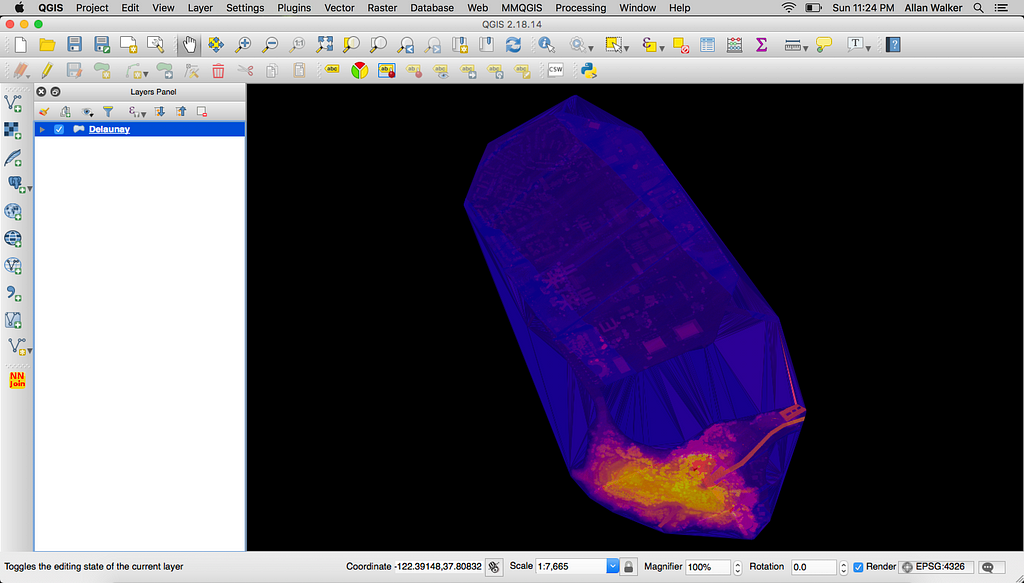
Which needs to be clipped (Menu → Geoprocessing Tools → Clip) by the Intersect layer we used in step #3 to get rid of the extraneous triangles that are covering the water between the shorelines.
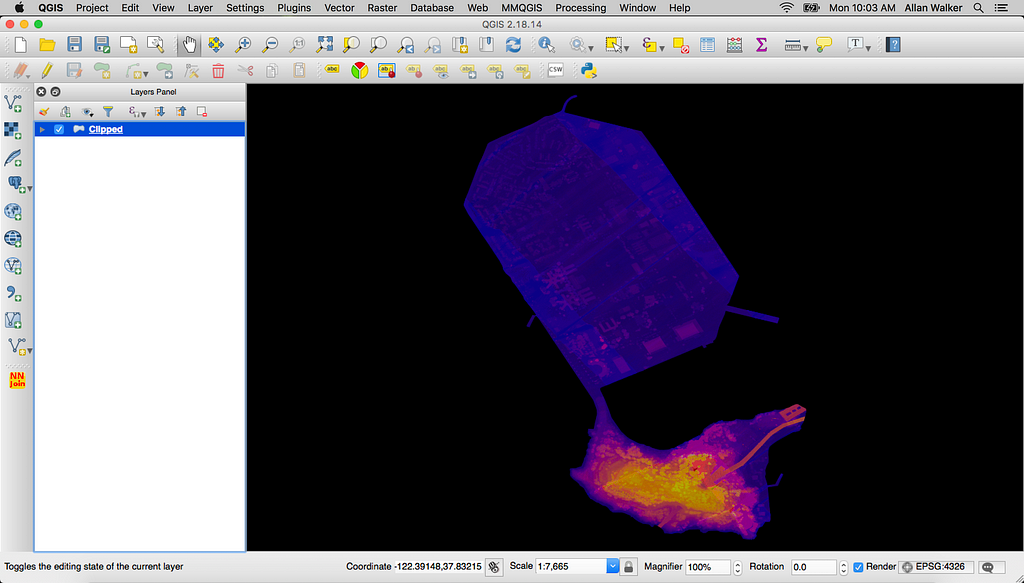
Now we’ve made our LIDAR points into those tessellated triangles, it’s on to our final steps: Saving this back to GeoJSON, and then on with my new hobby: “Tippe-canoeing”. Yes, I made a verb out of Eric Fisher’s awesome tool to convert GeoJSON to Mapbox Vector Tiles, Tippecanoe.
6. Tippecanoe & Studio
Tippecanoe is a Command Line Interface tool. After downloading and installing Tippecanoe to your Mac or Linux box, do a “cd” to get to the directory that the converted GeoJSON is in. Then after the prompt (something like computername: directory username$) I’ll type:
tippecanoe -o TILIDAR.mbtiles -Z10 -z20 -aN ClippedDelaunay.geojson.
What that is doing is instructing Tippecanoe to output Mapbox Vector Tiles with a name of TILIDAR.mbtiles, with a minimum zoom of 10, and a maximum zoom of 20, using the ClippedDelaunay.geojson file. The -aN switch dynamically combines small features.
Tippecanoe is a rocket ship. It completes the transformation of a 1.6 GB GeoJSON file with 13.3 million features, down to a very efficient 327 MB Mapbox Vector Tiles file!
After uploading the TILIDAR.mbtiles file as a tileset in Studio, I’ll create a new fill extrusion layer: TreasureIslandLIDAR:
- Set the Height value to data field elevation (understanding that the minimum value is -33 meters, but setting that height to 0; and the maximum is 97.91 meters, and thus setting the height to 131.58);
- Set the Color value to the same to the height values;
- Add the Satellite Raster layer, with a saturation of -1;
- Add the Water layer as a fill, with a color of black;
- Add a background layer, with a color of black;
- Finally, the clip layer (the outline of the Treasure Island), with a color of black.
Hopefully a lot less like Legos or Minecraft!
Add LIDAR to Mapbox was originally published in Points of interest on Medium, where people are continuing the conversation by highlighting and responding to this story.