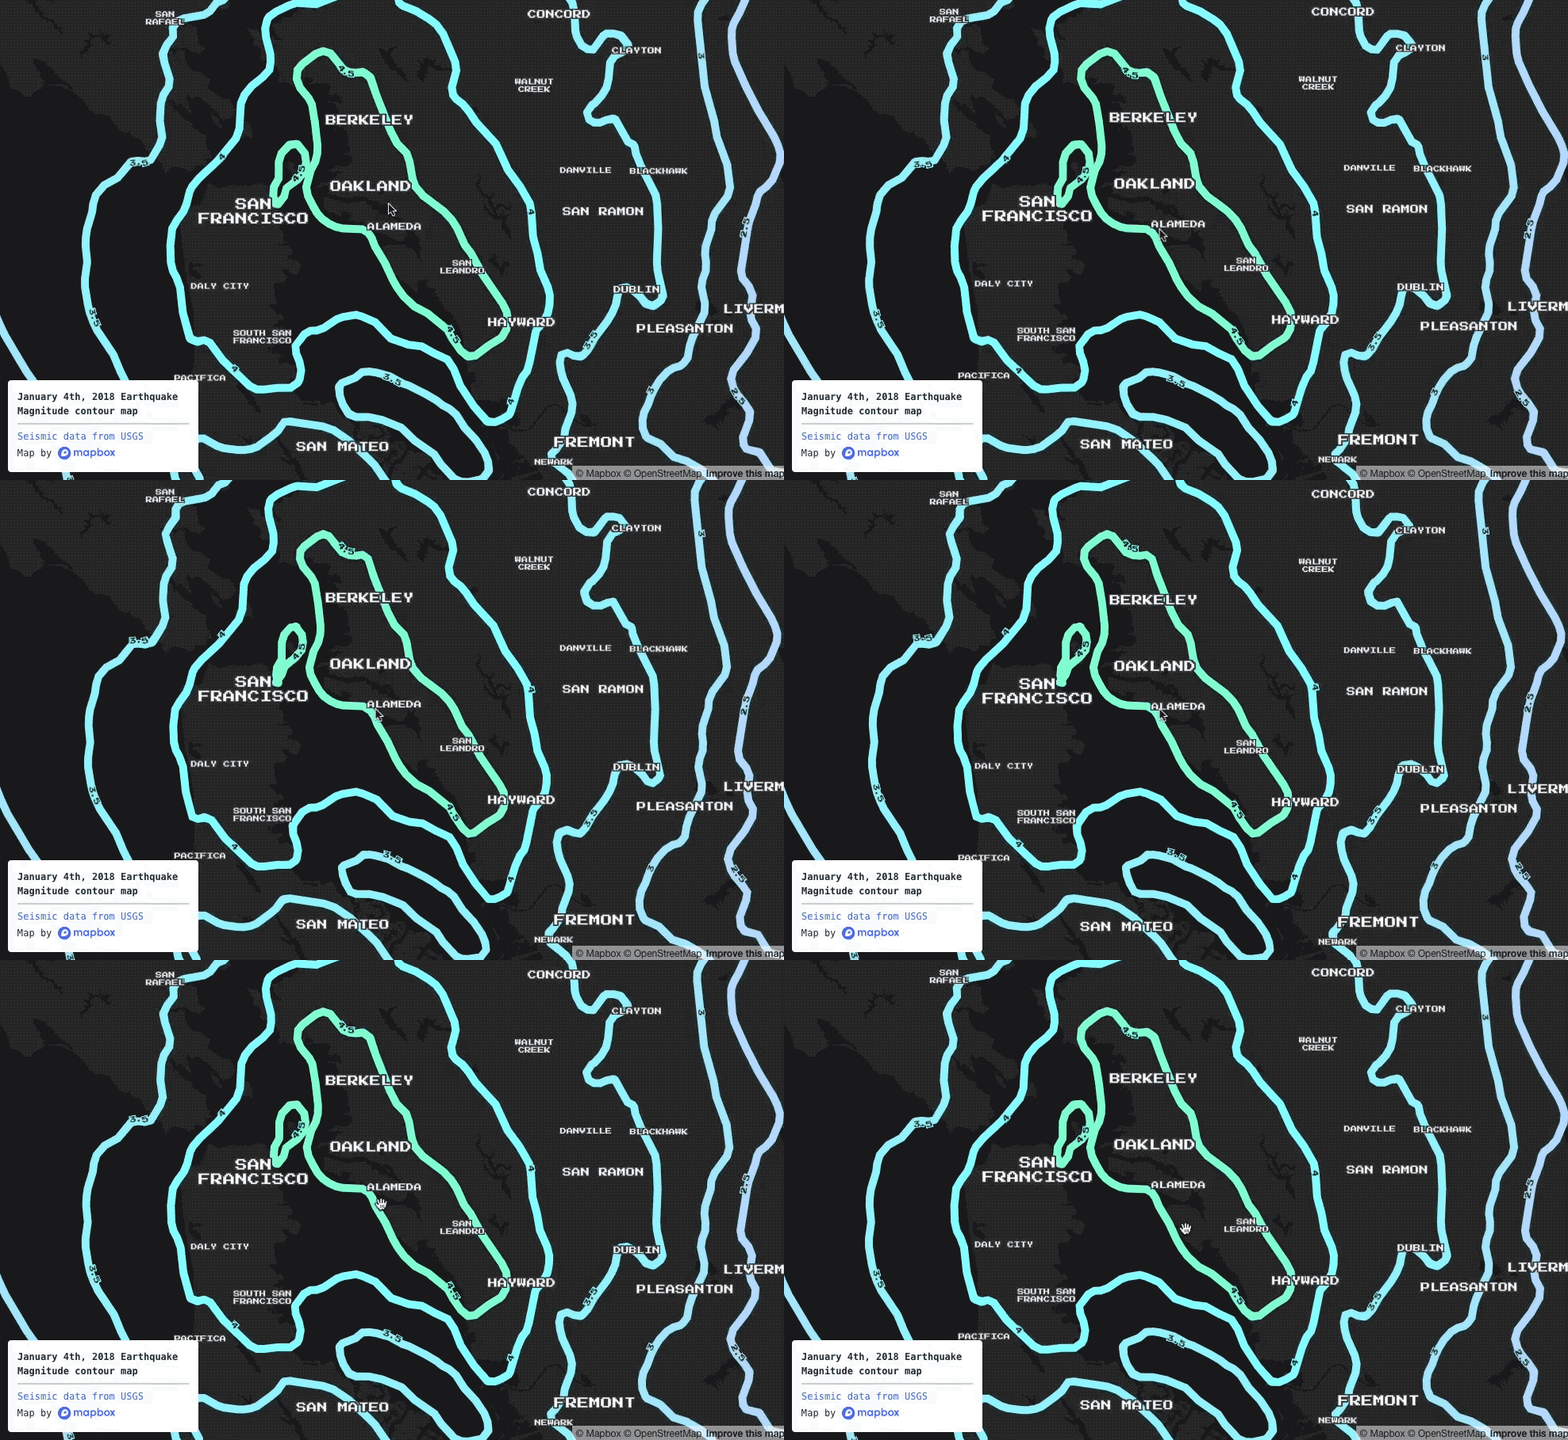
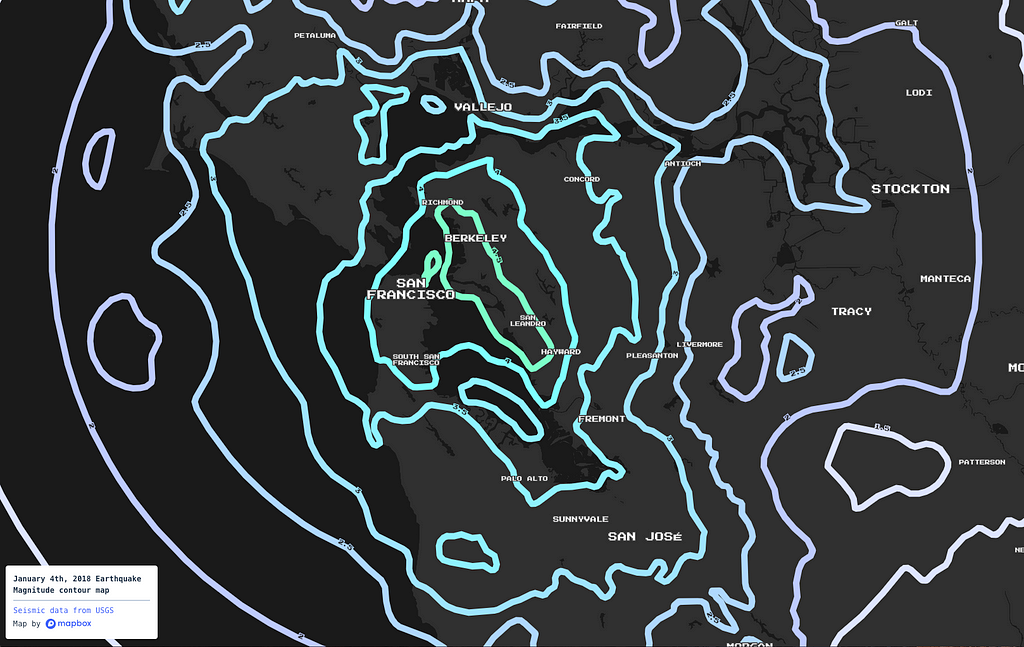
A few nights ago, along with many Bay Area residents, I was awakened by a 4.4 magnitude earthquake. The epicenter was outside of Berkeley, California. The earthquake was just the inspiration I needed to whip up a map with Studio.

Studio is great for one-off creative data visualization projects like this. Here’s how to go from a blank screen to an animated earthquake map in just a few steps.
Step 1: Get earthquake data
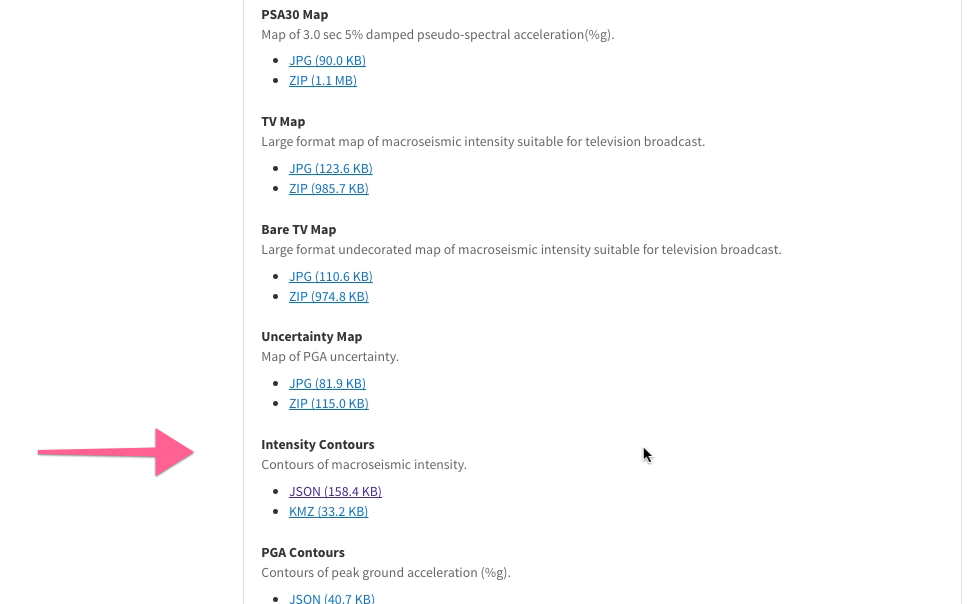
An excellent resource for earthquake data is usgs.gov. Lots of data on the January 4th, 2018 Berkeley earthquake is available, but we specifically want “Intensity Contours”, in geoJSON format. Go to the earthquake event page to download the data (or download it directly).

Step 2: Add the earthquake data to Mapbox
Go to the tileset page in Studio, click the “New tileset” buton, and drag & drop your earthquake geoJSON file onto the dialog box. The upload may take a moment to process.
Step 3: Create a style
When your upload completes, navigate to the tileset view page from the upload notification widget, then select “Add tileset to style” and pick a new blank style.
Step 4: Theme your style
Once you have a style, time to get creative. There are two main components to this step. First, color code your earthquake contour lines using their color property. Let’s use the following identity function to do this:
{"type": "identity",
"property": "color"
}
Next, let’s add some context to the map style. The basic features we need include water bodies and place labels, so let’s add two more layers:
Experiment more at this phase until you’re happy with your style. Finally, click the “Publish” button to make your style available from the share page or via our SDKs.
Bonus: Animate your style
Now that we have an earthquake map, as a final step, let’s roll up our sleeves and write some JavaScript. Before starting, rename the contour line layer “contour-lines”. Make sure to publish again after that change. Then, visit this JS Bin that has some boilerplate code that performs looping animations in GL JS. I made sure to add code comments to explain what each function in the Bin is doing.
Want to try it for yourself? Add your own your Mapbox map style id and access token to the Bin to start, and experiment from there to create your own animated earthquake map! Share what you build on Twitter using #BuiltWithMapbox.

Make a creative earthquake map with Studio and GL JS was originally published in Points of interest on Medium, where people are continuing the conversation by highlighting and responding to this story.