How I mapped the leaked changes to national monuments
By: Lo Bénichou
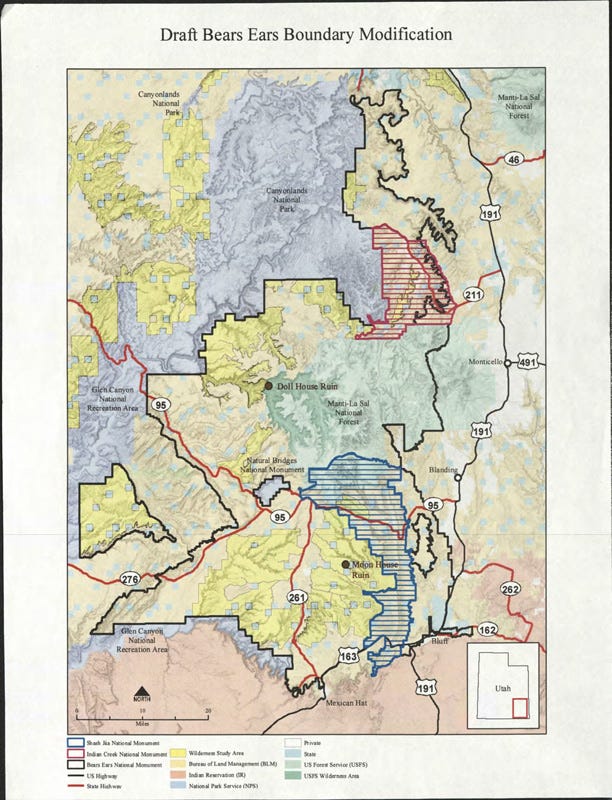
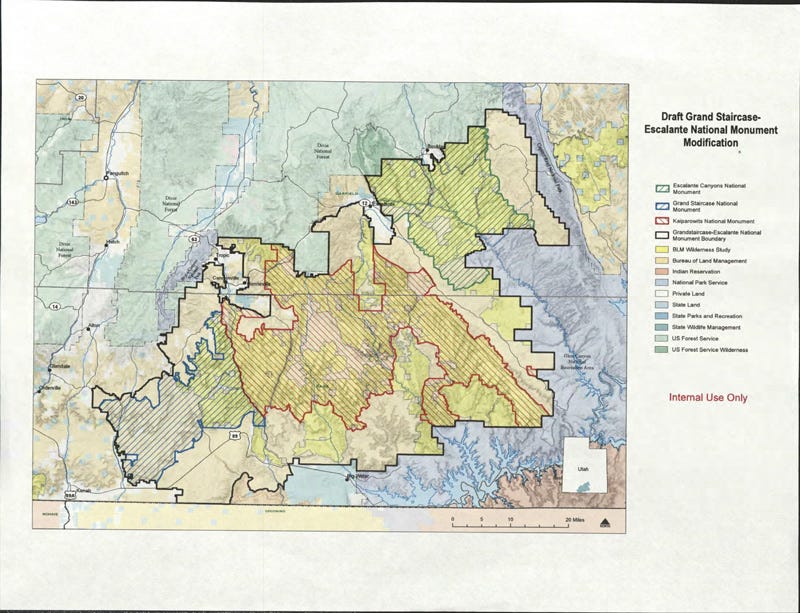
On November 30th, 2017, The Wilderness Society published leaked government maps showing the possible boundary modifications to Bears Ears and Grand Staircase-Escalante National Monument in Utah. Unfortunately, the leaked documents are not geo-referenced, and the data is currently unavailable elsewhere. This guide will walk you through geo-referencing, tracing, and finally, publishing a map with manipulable data.
Setup
To get started, you will need to download and install QGIS. QGIS is a free and open source geographic information system. It comes pre-packaged with GDAL, a python library, which you are going to use to geo-reference the boundaries.
Once you’ve installed the necessary software, sign up for a Mapbox account. It’s free! We’re going to use Mapbox’s Dataset feature to draw polygons and upload them into Studio.
Step 1: Geo-reference in QGIS
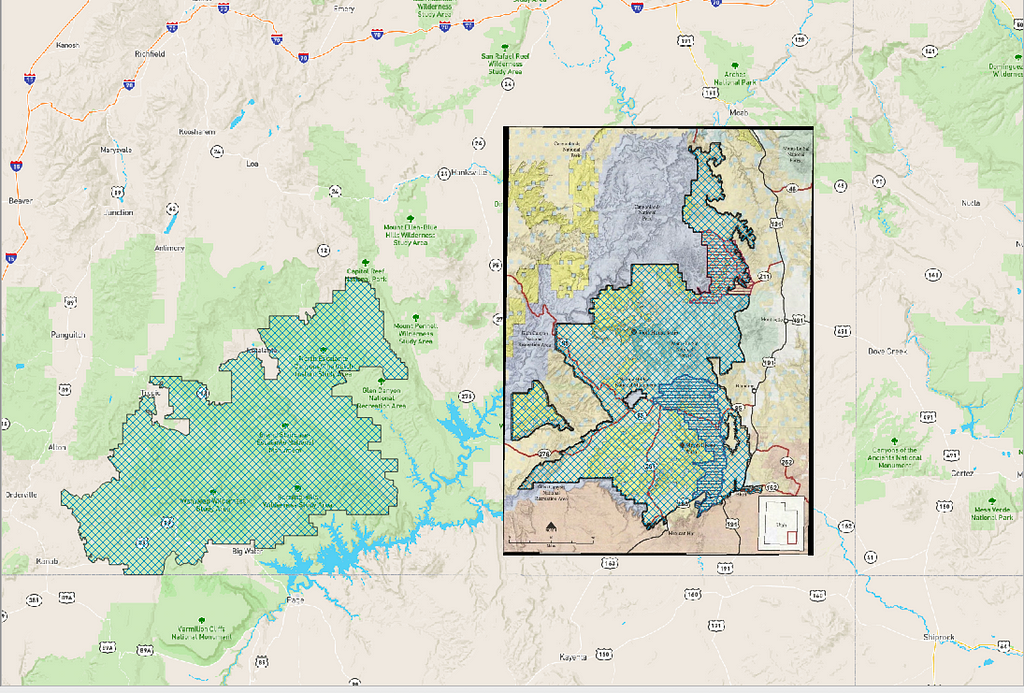
First, download a copy of the PDFs you’d like to transform. In this example, we’re using the two scanned maps below.
Clik here to view.
Clik here to view.
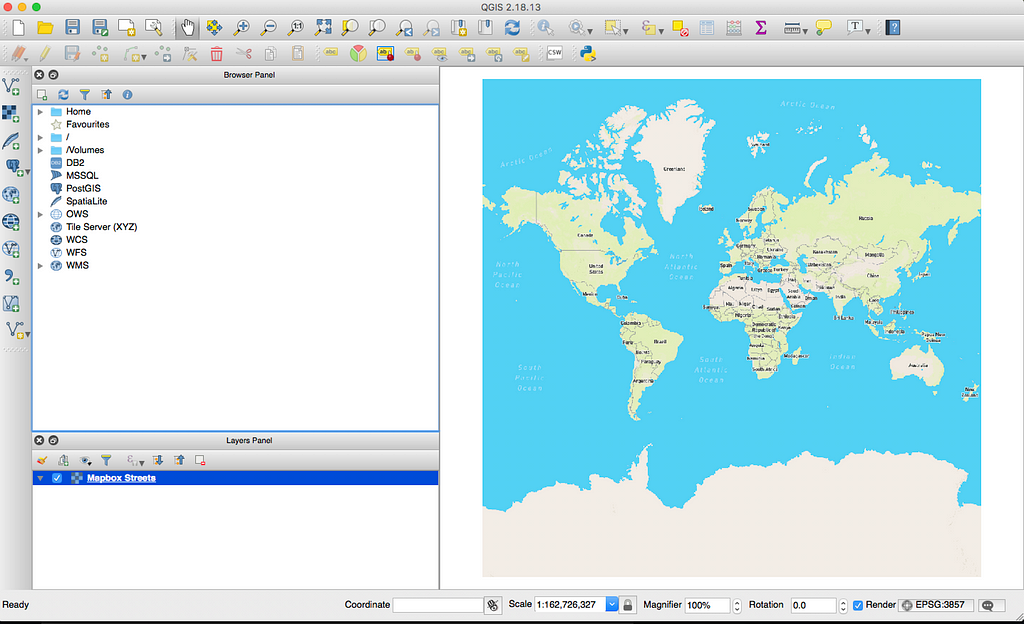
Then, open QGIS and add a Mapbox style as a layer. This will serve as a guide when you start geo-referencing the areas on the map. You can follow these instructions.
Now that you have your Mapbox layer setup, you’re ready to tackle geo-referencing.
Clik here to view.
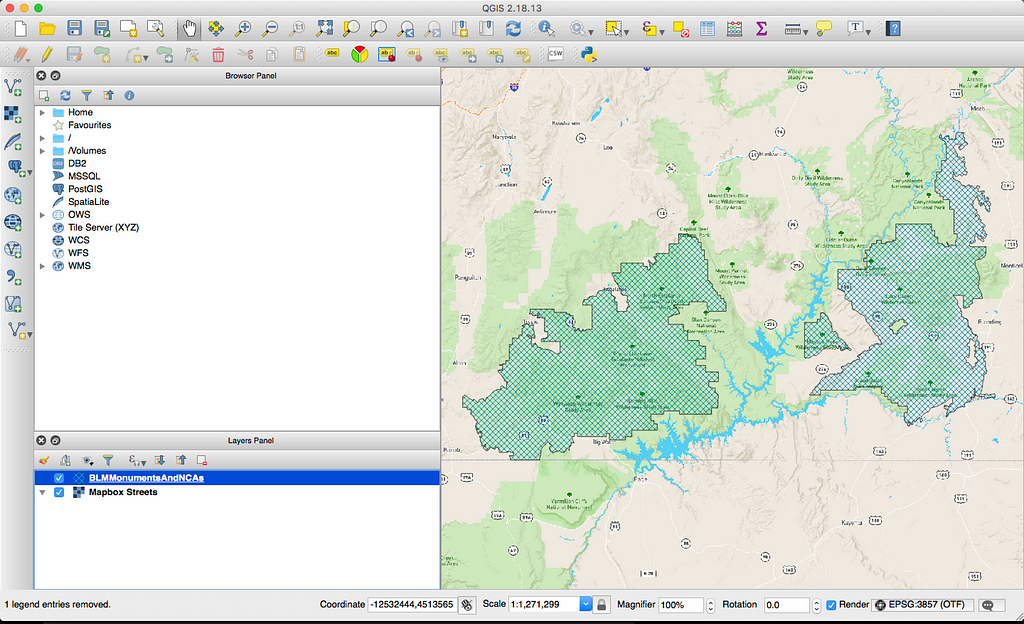
The best way to geo-reference a static map is to set up as many visual aids as possible. In this case, you have access to current monument boundaries. Add them to your current project and use them as guides.
Clik here to view.
From there, follow this detailed guide on how to reference scanned maps using the ‘Georeferencer GDAL’ plugin. Make sure to reference at least 4–5 points and to use the correct projection (EPSG:3857).
Clik here to view.
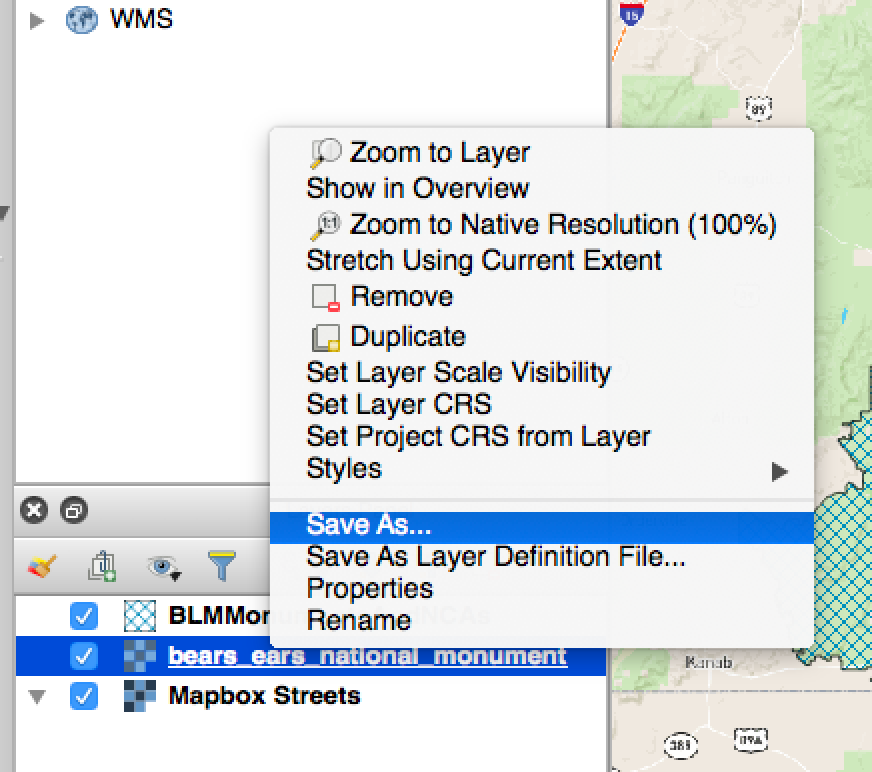
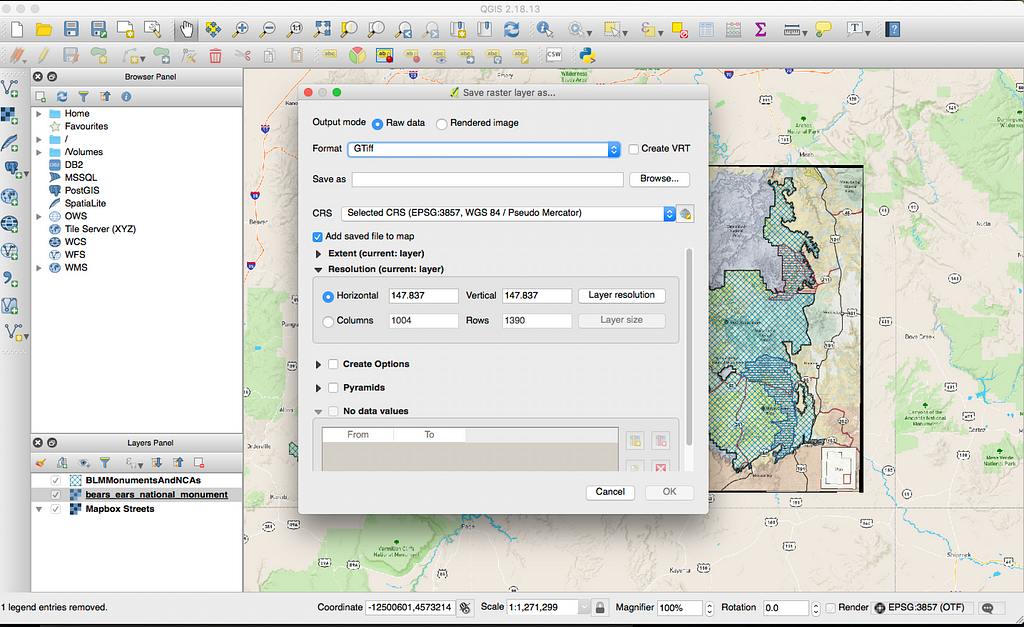
Once you’ve processed the image, you should see a new layer appear in your layer panel. This new layer is a raster image, or a geo-referenced version of the static map. Right-click on the layer, and select “Save As…”. Save the .tif file in the desired location. Next, upload the raster image as a tileset in Studio.
Clik here to view.
Clik here to view.
Step 2: Tracing in Mapbox
Uploading the raster as a tileset in Mapbox Studio will allow us to use the static map as a visual aid to trace the boundaries, using the Dataset feature.
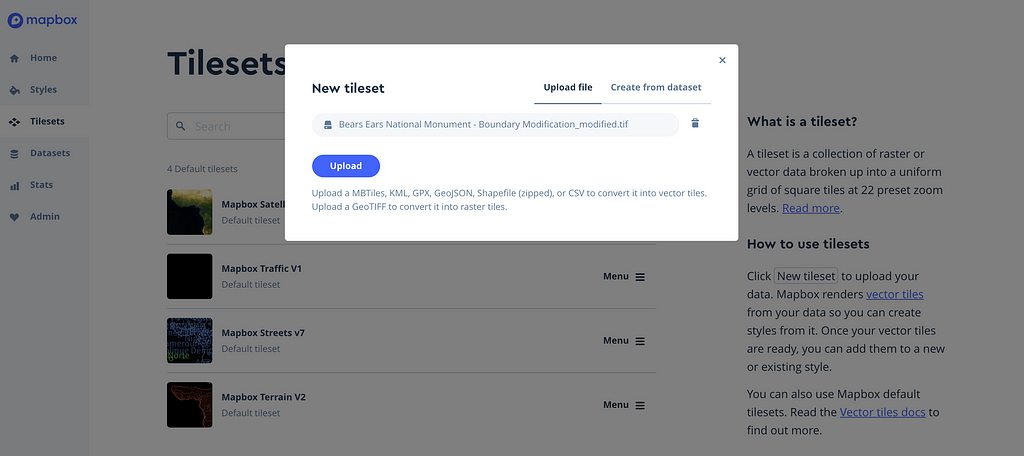
Go to your Studio dashboard, click New Tileset, and select the correct raster file. Click Upload.
Clik here to view.
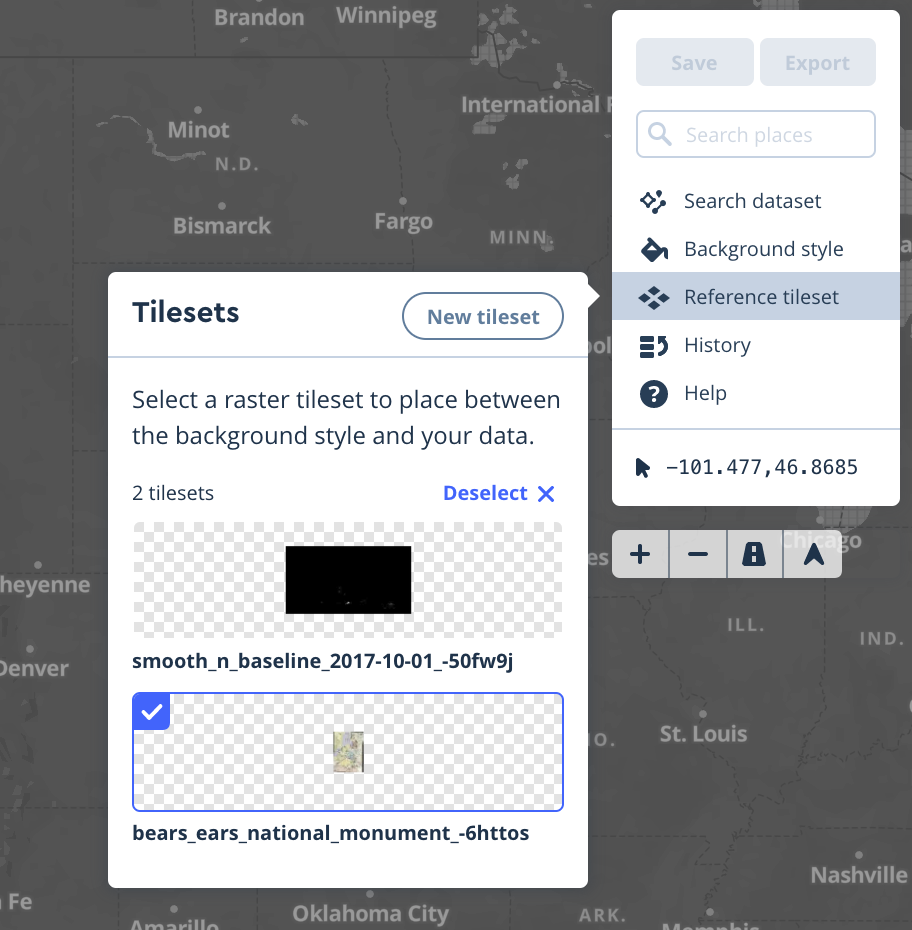
Next, go to Datasets on the right, and create a new dataset. On the left, click on Reference Tileset and select the tileset you’ve just uploaded. You should see the monument area added to the map. Now, let’s trace!
Clik here to view.
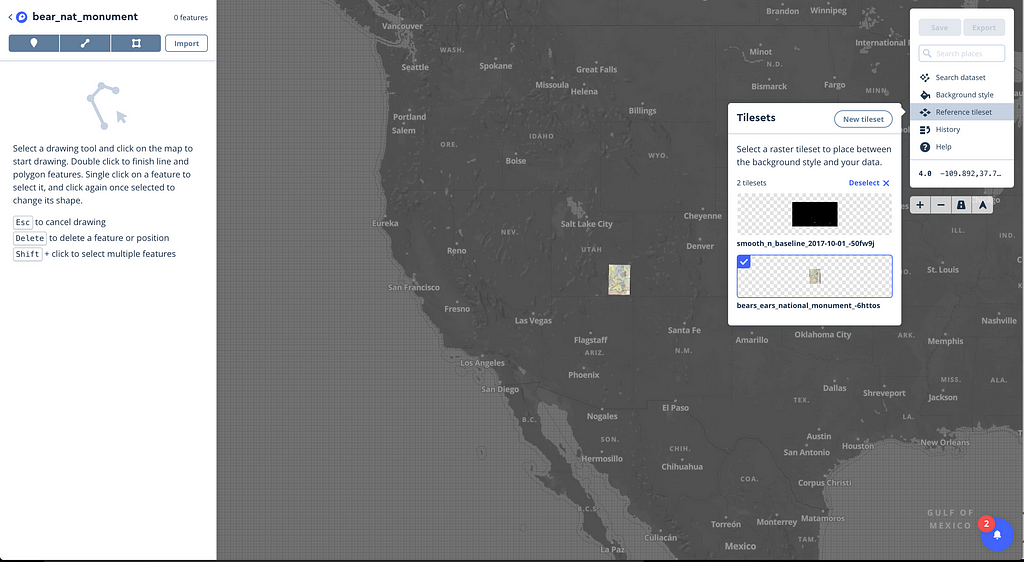
Clik here to view.
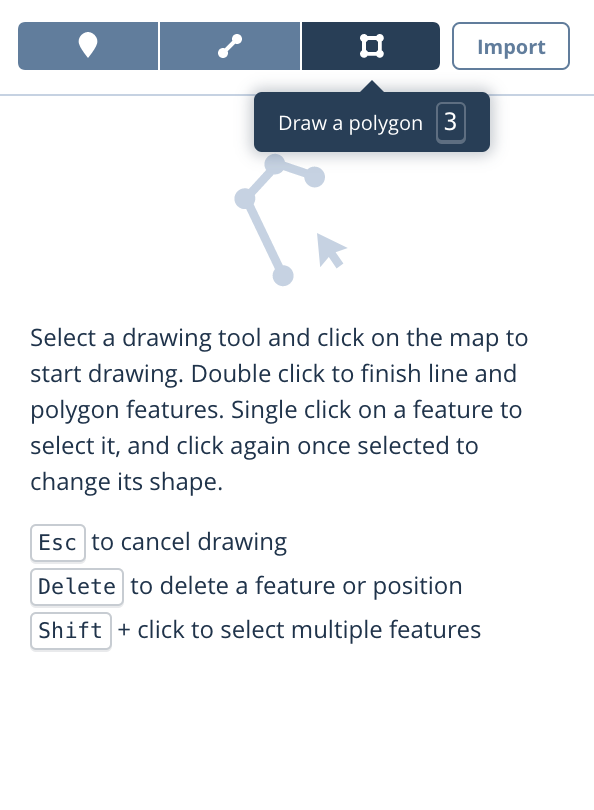
Click on Draw a polygon and start assigning points following the proposed boundary you’d like to reference.
Clik here to view.
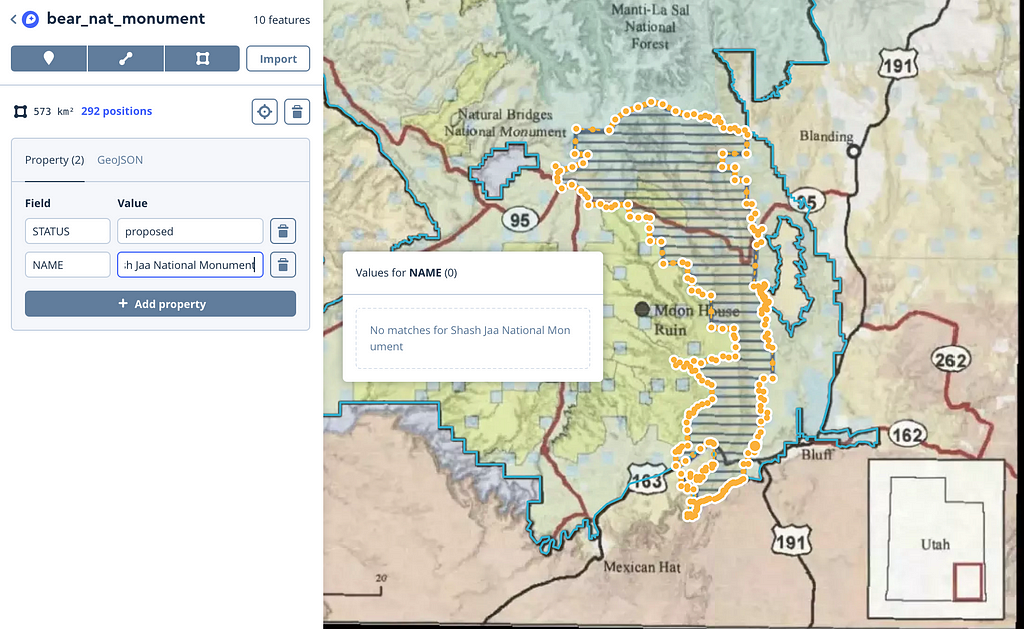
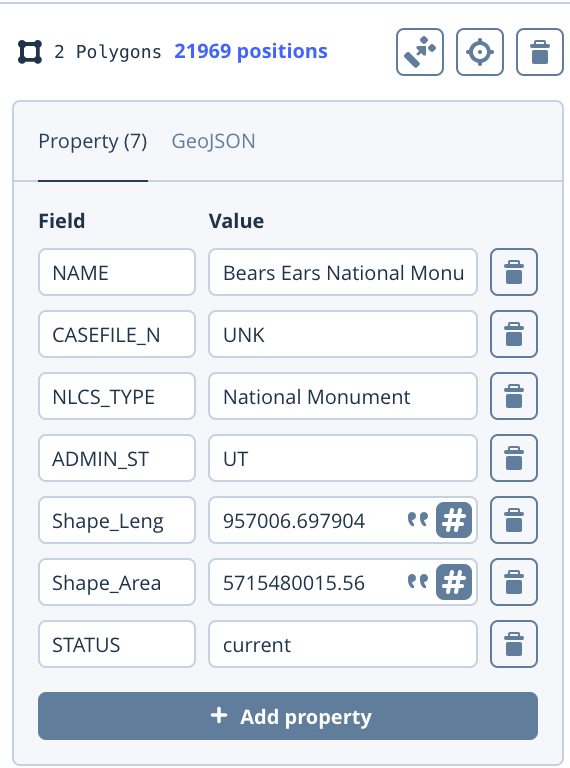
Once the first polygon is fully traced, start tracing the next one. You can also assign custom properties to the shapes you’ve just drawn. Here, I’ve added the name of the area as well as a status property to be able to distinguish between current and proposed boundaries.
Clik here to view.
This is optional, but you can also add the current boundaries’ polygon and get all your data in one place. In order to properly differentiate, I added the status property and set it as current.
Clik here to view.
After tracing the proposed boundaries and uploading the current ones, you should see the following shapes. Optionally, you can add points in order to properly place labels for each region on the final map.
Clik here to view.
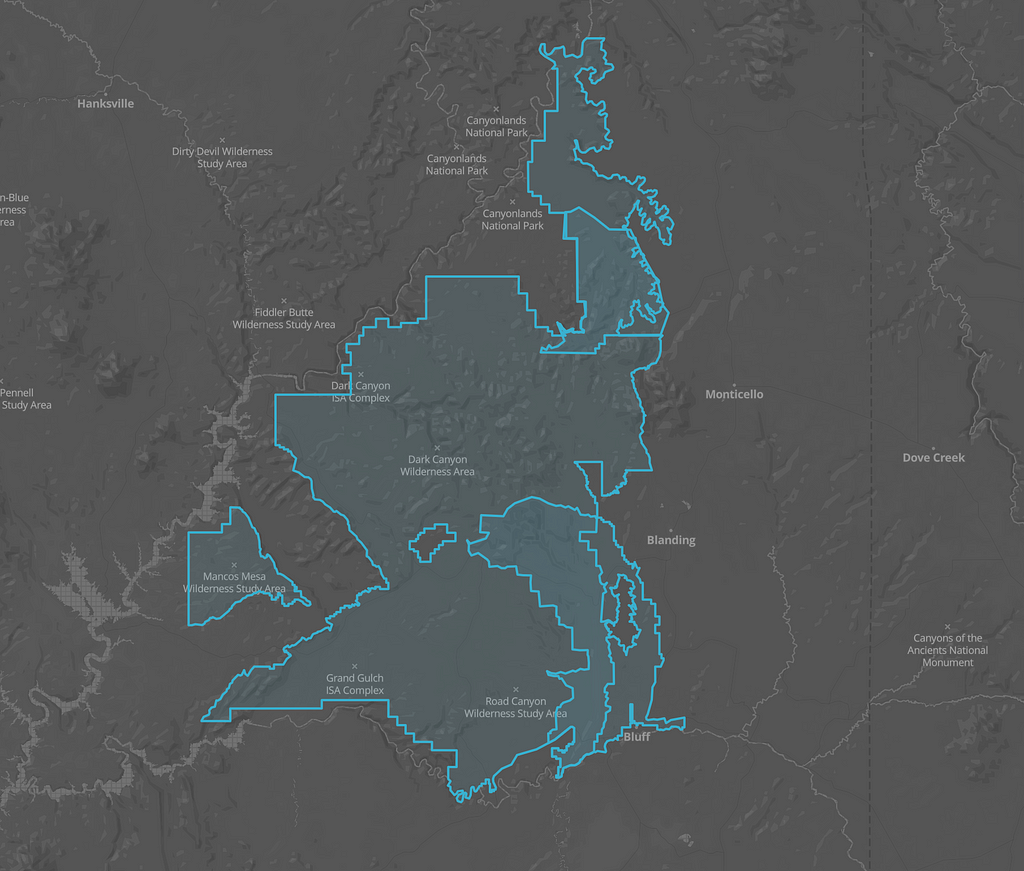
You can now save and go back to the Dataset dashboard. From here, you can download the data as a GeoJSON or add it to a map in Studio by exporting it as a tileset.
Clik here to view.

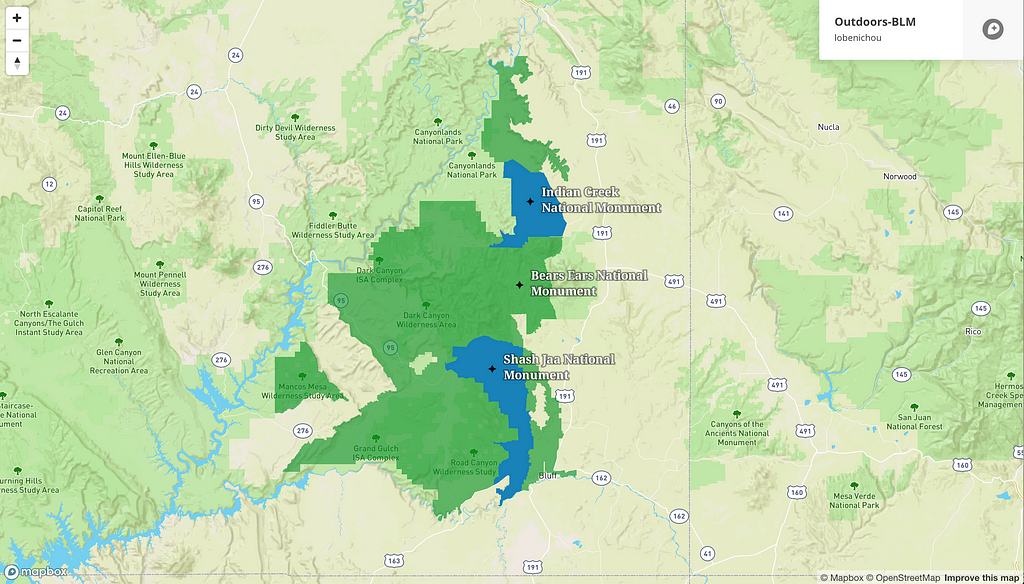
Explore the proposed monument changes. Here’s the full map.
Use our tools to tell a story with location data, especially when the stakes are high. Check out some recent projects from the The New York Times and VICE, and explore our tutorials for creating maps and adding interactivity. Have questions? Ask us on Twitter, @mapbox.
Clik here to view.
Clik here to view.
Turn static images into interactive maps was originally published in Points of interest on Medium, where people are continuing the conversation by highlighting and responding to this story.