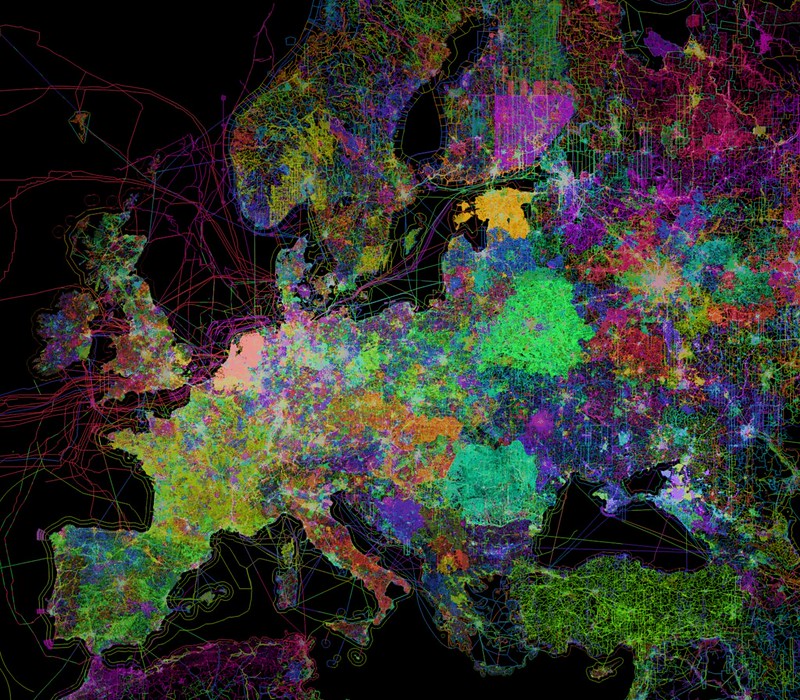
OpenStreetMap is created every day by thousands of users logging in and improving the map. Here is a visualization of this amazing social fabric of individuals working together. We generated a color for each road segment from the user ID of the mapper who last edited it to show how many individual contributions large and small add up to a collaborative map of the world. Take a look at how many people have been mapping near you.

This is OpenStreetMap colored by contributor in Europe.

Cities like London show a complex pattern of contributions.

In North America, dense areas where the map has been refined by many people contrast with rural expanses of imported map data.

North America's Atlantic coast. You can see how neatly mapping activity often splits along borders.
Here's the full interactive map.